Your medical test came back positive. The lab report says the test is 99% accurate. Your stomach flips. But before you call your doctor in a panic, take a step back: that 99% is not the same number as “99% chance you’re sick.” In fact, if the disease is rare, the right number could be under 10%. That gap between “test accuracy” and “your actual chance” is the false-positive trap, and it is the most common place Bayesian reasoning goes wrong in everyday life.
The Bayes Theorem Calculator takes three numbers — a prior, a likelihood, and a false-positive rate — and turns them into the one number that actually matters: P(A | B), the probability that you have the condition given that the test just said positive. Three inputs, one output, but each input carries a hidden assumption that quietly decides whether the result is useful or nonsense.
What the three inputs actually mean
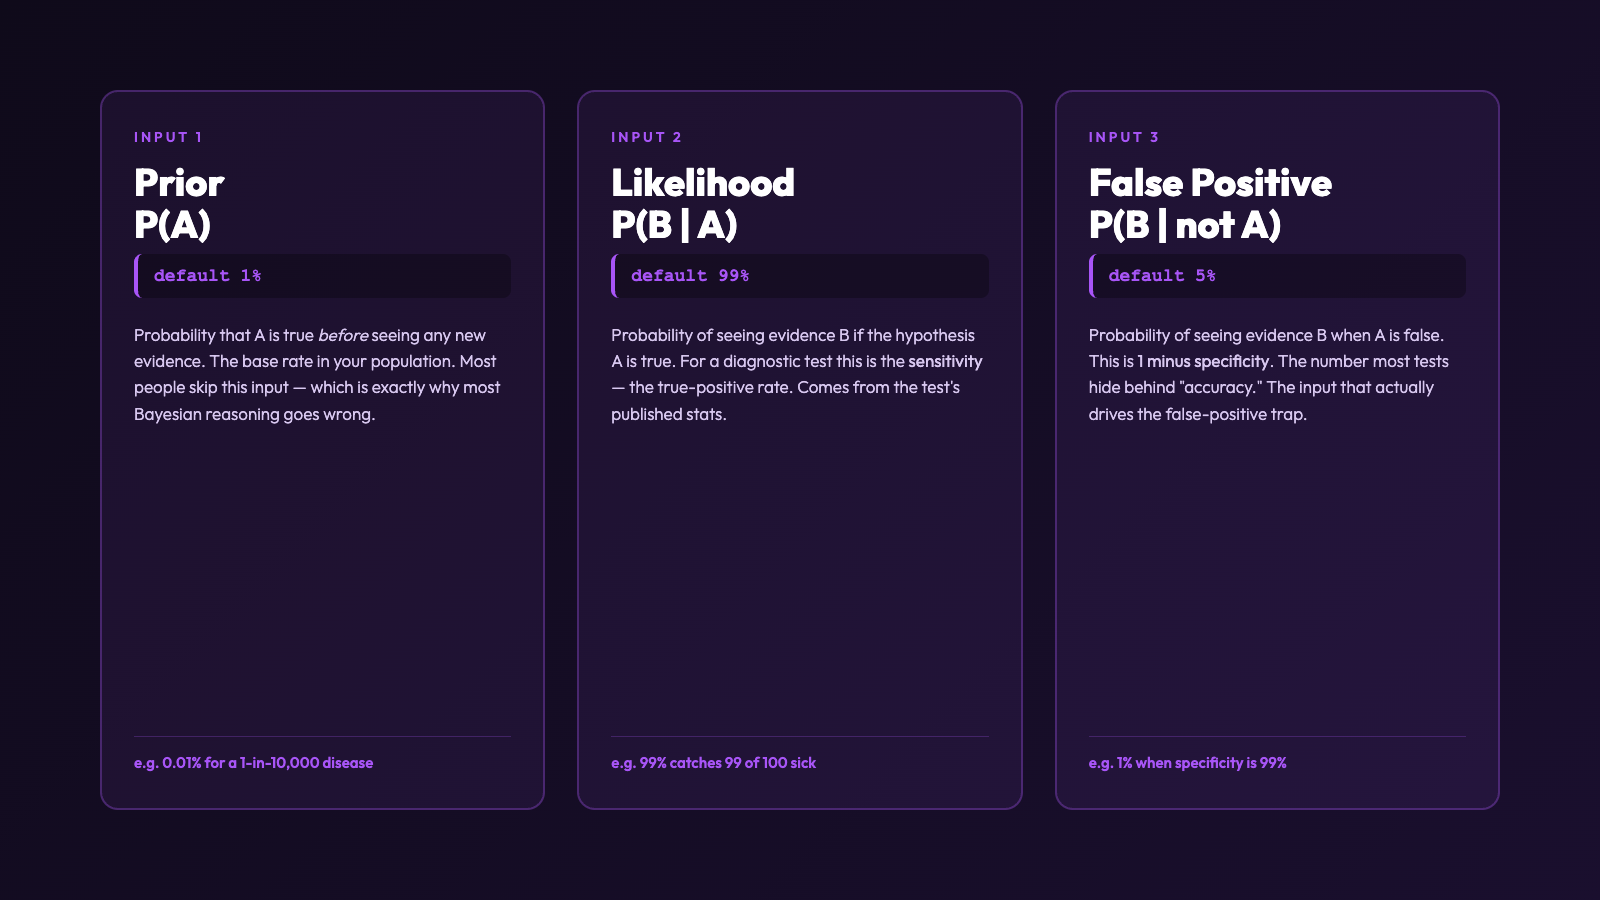
The calculator accepts three inputs on a percent scale by default: P(A) is the prior, the probability that the thing you are testing for is true before you collect any new evidence. For a rare disease affecting 1 in 10,000 people, P(A) is 0.01%. For a 10-year-old’s runny nose in flu season, P(A) might be 30%. The prior is the number most people skip, which is exactly why most Bayesian reasoning goes wrong.
P(B | A), the likelihood, is the probability of seeing this evidence if the hypothesis is true. For a diagnostic test, this is the sensitivity — the true-positive rate. A test with 99% sensitivity catches 99 of every 100 sick people. P(B | not A), the false-positive rate, is the probability of seeing the evidence when the hypothesis is false. For a test with 99% specificity, this is 1%. Most published test stats hand you sensitivity and specificity — they hide the fact that what you really need is the false-positive rate, not the accuracy.
The formula hiding inside the calculator
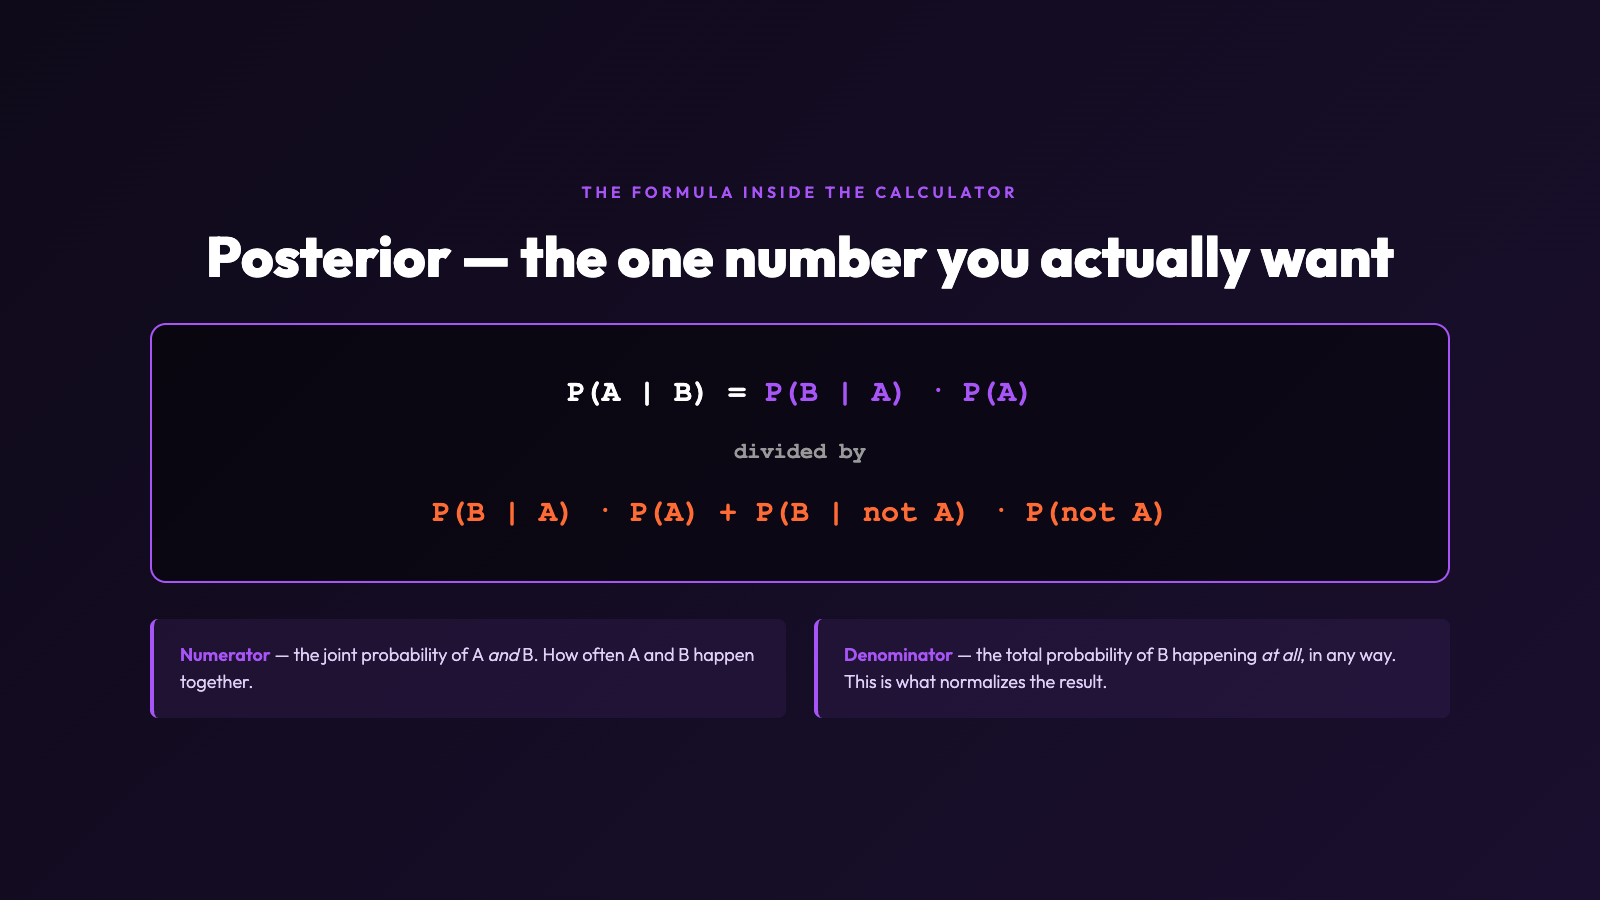
Strip the calculator open and the formula is the standard posterior:
P(A | B) = P(B | A) * P(A) / [ P(B | A) * P(A) + P(B | not A) * P(not A) ]
The denominator is the total probability of seeing evidence B at all — it normalizes the joint probability of “A and B” against every way B could have happened. When the prior is tiny and the false-positive rate is non-trivial, the denominator is dominated by the false-positive term, and the posterior collapses to something much smaller than the likelihood alone would suggest.
Why “99% accurate” is almost never 99%
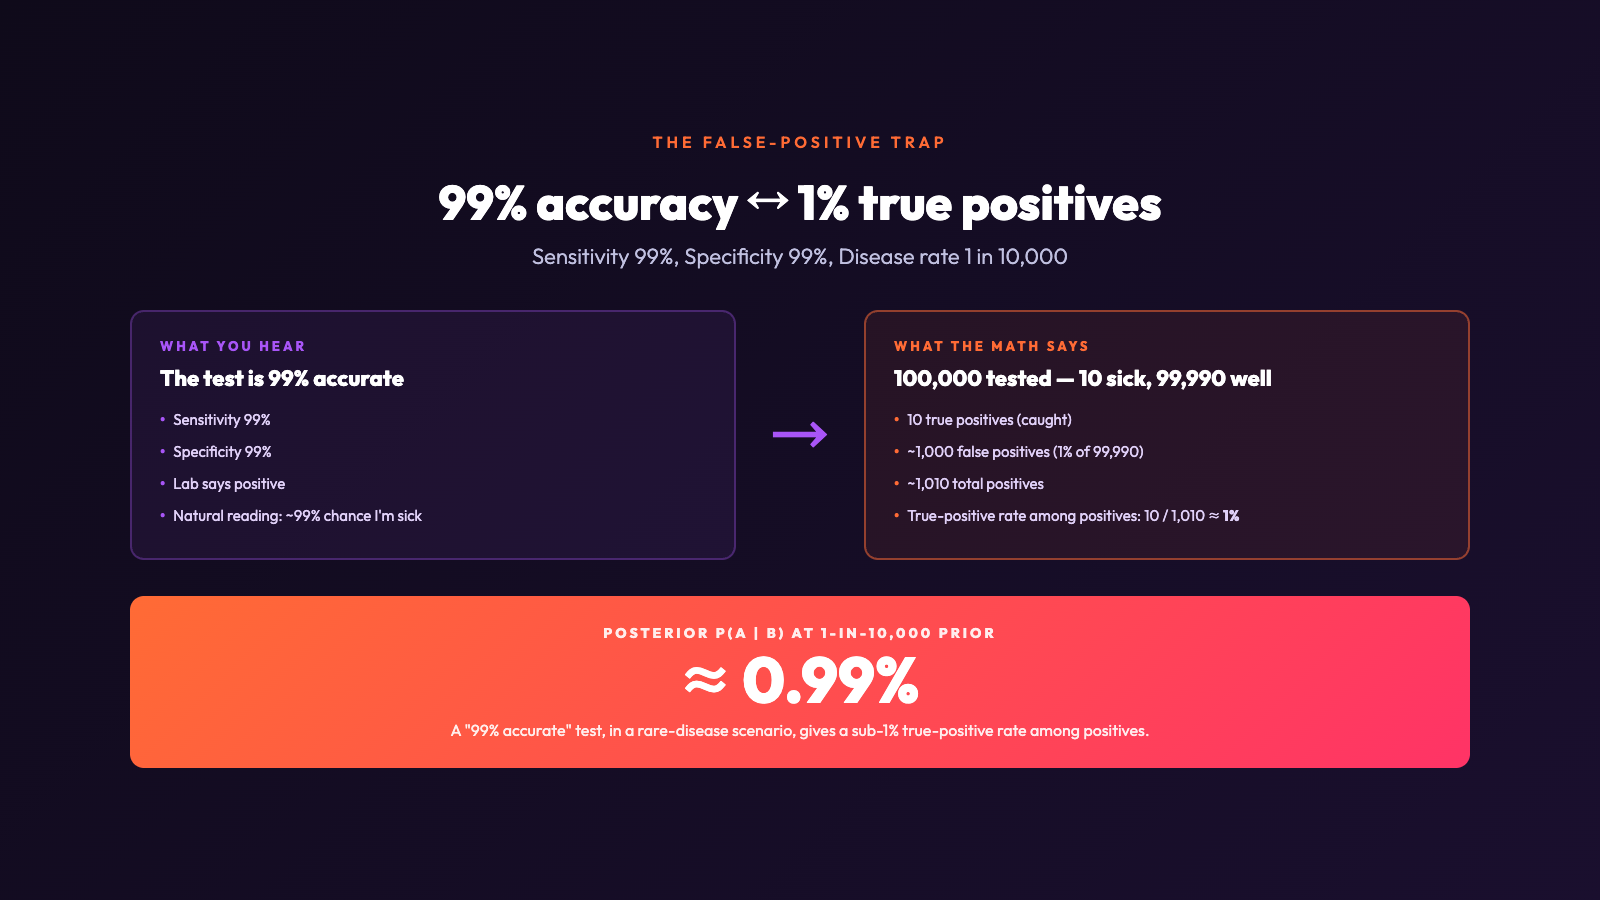
Imagine a screening test advertised as 99% accurate. Sensitivity 99%, specificity 99%. Now imagine the disease affects 1 in 10,000 people — so P(A) = 0.0001. Among 100,000 people tested, you expect 10 true cases and 99,990 non-cases. The test will catch roughly 10 of those 10 sick people (true positives) and flag roughly 0.01 * 99,990 ≈ 1,000 healthy people as positive (false positives). The total number of positives is about 1,010. The probability that any one positive is a true case is 10 / 1,010 ≈ 1%. A “99% accurate” test, with a 1-in-10,000 prior, gives a 1% true-positive rate among positives. That is the false-positive trap in one number.
Plug the same numbers into the Bayes Theorem Calculator and you get the same answer in one click: P(A | B) ≈ 0.99%. The calculator does not lie, does not round, and does not skip the prior. It shows the gap between “the test is accurate” and “you probably have it” in a way that intuition reliably misses.
Where the three inputs come from in practice
Each of the three inputs needs to come from somewhere you can defend. The prior should reflect the base rate in the population you are actually testing, not the rate in the disease literature as a whole. A mammogram-screening population has a different prior from a self-selected worried-well population. The likelihood should come from the test’s published sensitivity in a peer-reviewed study, ideally adjusted for the population you are screening. The false-positive rate should come from 1 minus the test’s specificity, also from a peer-reviewed source, and ideally for the same population.
The calculator’s input scale selector (percent vs proportion) is the most overlooked control. If your prior is 1 in 10,000 and you enter it as 1 instead of 0.0001, the calculator will happily report a posterior of ~98.99% — a number that is mathematically correct but completely useless for the question you are asking. Always double-check that all three inputs are on the same scale.
What you can and cannot do with the posterior
The posterior P(A | B) is the probability that the hypothesis is true given the evidence. It is not the probability that the test was wrong. It is not the probability of being healthy given a negative result — that requires a separate calculation (P(not A | not B), which the calculator does not output directly but which is straightforward to derive). It is also not a probability that updates automatically — if you run the test again, the posterior from the first test becomes the prior for the second.
For a decision tool, the posterior is what you compare against the threshold that would change your behavior. In medicine, that threshold might be 5% before you treat. In spam filtering, that threshold might be 90% before you drop the email. In risk scoring, it might be the level at which you flag for manual review. The calculator gives you the posterior; the threshold is your call.
Putting it together with three numbers
Run the calculator once with realistic numbers — a 1% prior, 95% sensitivity, 4% false-positive rate (the kind of numbers you would see in a moderate-prevalence screening scenario) and you get P(A | B) ≈ 19.5%. That is, a positive test in this scenario gives a 19.5% chance of true disease — high enough to warrant a follow-up, low enough to not panic. Compare that to the natural-language reading of “95% accurate, 4% false positives” and you can feel how far the gap is between intuition and the actual math.
That gap is the article’s point. The three inputs — prior, likelihood, false-positive rate — are easy to find in a test’s published statistics, easy to enter into the Bayes Theorem Calculator, and easy to misread if you skip any one of them. Run the numbers before you make the decision, not after.
For more statistical reasoning tools, browse the full Elysia Tools catalog.