Most people discover the biorhythm chart by accident. They type their birth date into a website, see three colored sine curves swing through +100 and -100, and notice today happens to be a “double critical day” — two curves crossing zero at once. The website helpfully tells them this is a bad day for decisions. They remember it the next time they have one and tell a friend, who then googles “biorhythm calculator” and lands on the same kind of site. Within three minutes both people are convinced the theory is real because the chart looks mathematical, the math is on the screen, and the page never mentions that nobody has been able to publish a peer-reviewed paper validating the 23/28/33-day cycles in over a hundred years of trying.
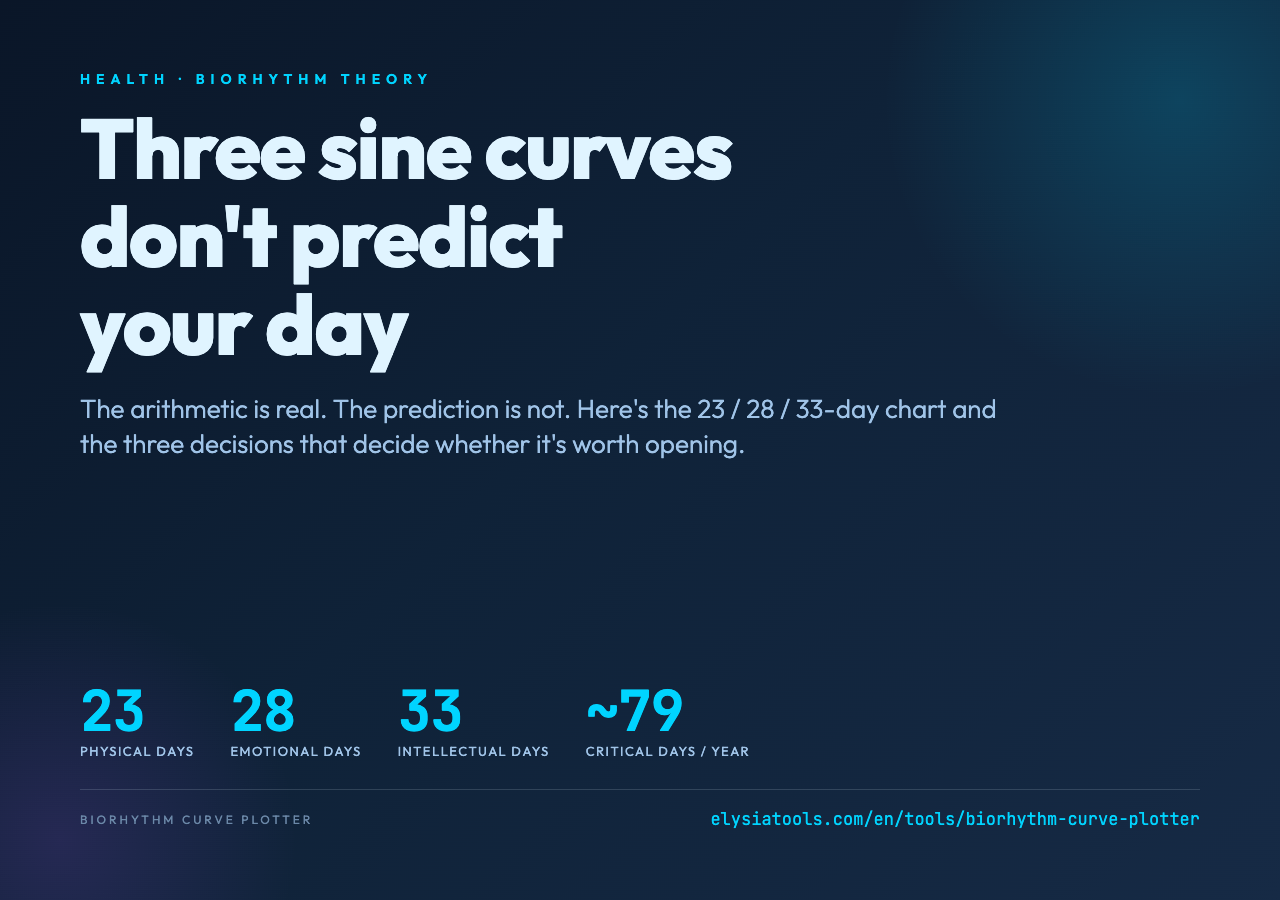
The thing that makes the chart persuasive — three exact integers (23, 28, 33) and clean sine math — is also what makes it a useful thinking tool once you strip away the predictive claims. Elysia Tools’ Biorhythm Curve Plotter is a fast browser-side implementation: enter a birth date and a target date, get an SVG of all three curves, a daily value table, and a list of upcoming zero-crossings. The output is honest about the theory’s status (the tool’s own description labels it “a historical curiosity and is not scientifically validated”), and the SVG is good enough to copy into a notebook if you want to compare days against your own log of energy, mood, or focus.
What follows are the three decisions that determine whether a biorhythm chart is even worth looking at — and the one decision where the chart’s “critical day” claim collapses under simple arithmetic.
Decision 1: Are you counting whole days from birth, or fractional days?
The classical biorhythm formula is one line of math: for each cycle, plot sin(2π · t / period) × 100, where t is the number of days between your birth and the target date. The result is a value between -100 and +100 that drifts up and down over the cycle’s period — physical over 23 days, emotional over 28, intellectual over 33.
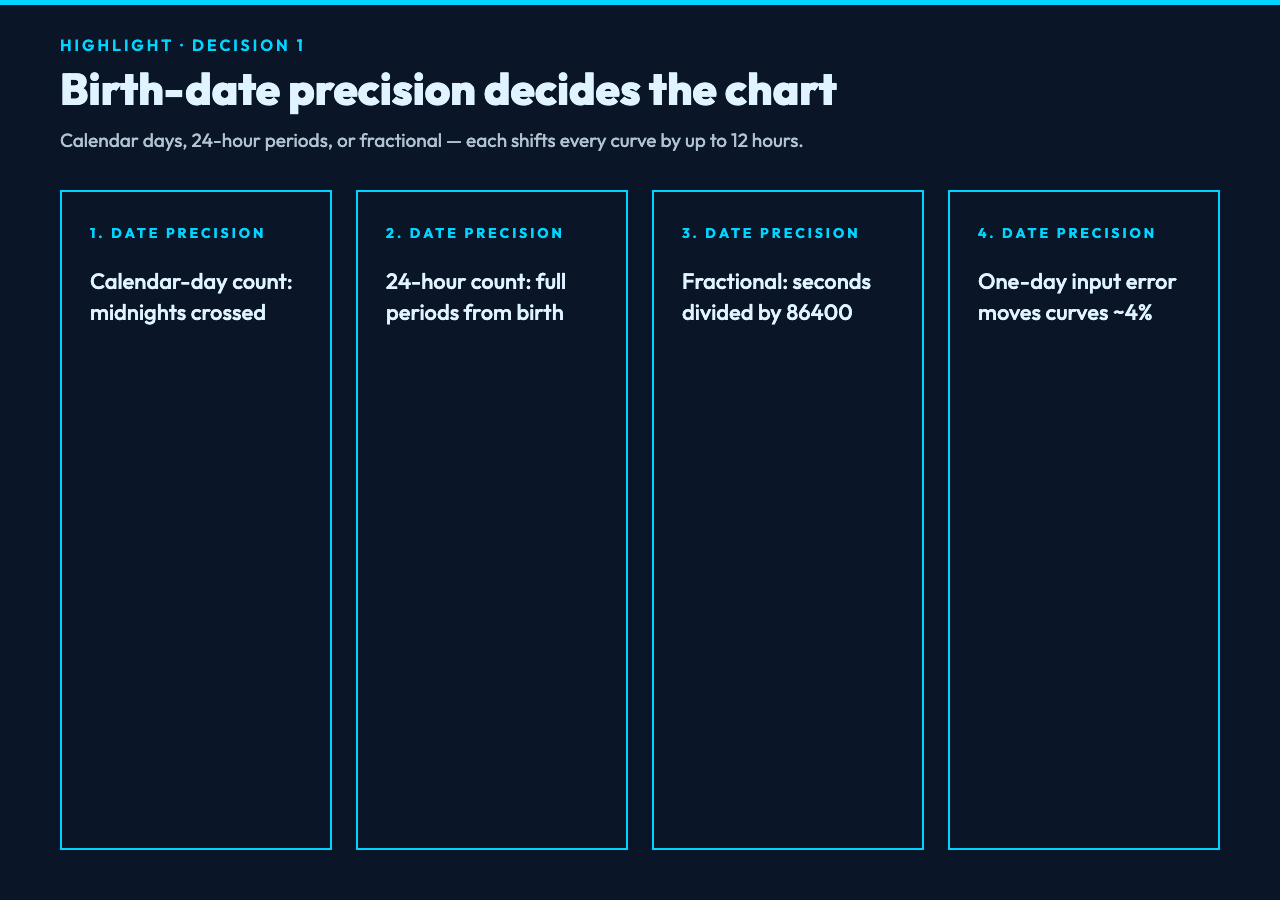
The whole calculation hangs on what t means. There are three reasonable definitions and they produce slightly different charts:
- Calendar-day count:
t= number of midnights crossed between the two dates. If you were born at 11:50 PM on January 1 and you check at 12:10 AM on January 2, you’ve lived through one calendar day. - 24-hour-period count:
t= number of complete 24-hour periods elapsed. If you were born at 11:50 PM on January 1, you don’t hitt = 1until 11:50 PM on January 2 — 23 hours and 40 minutes later than the calendar-day count. - Fractional day:
t= total seconds between the two timestamps, divided by 86400. This treats your birth time as the precise origin.
The first definition is what most browser biorhythm tools use, including the Elysia Tools plotter — the input is a date string, the engine computes integer day deltas, and the chart rounds each value to the nearest integer percent. The second and third definitions shift every curve by up to half a day, which means a “physical peak” on Tuesday under one definition might be a “physical valley” on Tuesday under another.
For someone born in the morning, this distinction is invisible — the two definitions agree to within minutes. For someone born at 11 PM, the definitions disagree by almost a full day. The chart doesn’t care which one you use because the chart’s job is to produce a sine wave, not a prediction. But if you’re trying to overlay your own log of “I felt great on March 14” against the chart, pick one definition and stick with it. Otherwise you’ll keep finding spurious correlations: “the chart said I should be down on March 14 but I felt up” turns out to be a rounding artifact, not a failure of the theory (which is good, because the theory fails on its own merits).
The bigger decision — and this one has no good answer — is whether the chart should use the date you entered or the date you meant. Most calculators default to “today” for the target date, so if you open the chart on a Tuesday morning at 9 AM and your birth date was a Tuesday at 9 AM, you happen to be at a known phase. But the chart can’t tell whether you typed the birth date you remember or the birth date on your passport, and a one-day error moves every curve by about 4% of its period. That’s enough to flip a “near zero” reading into “near peak” for the intellectual cycle, which is the most-shared number on social-media biorhythm screenshots.
Decision 2: Which of the three cycles are you actually tracking?
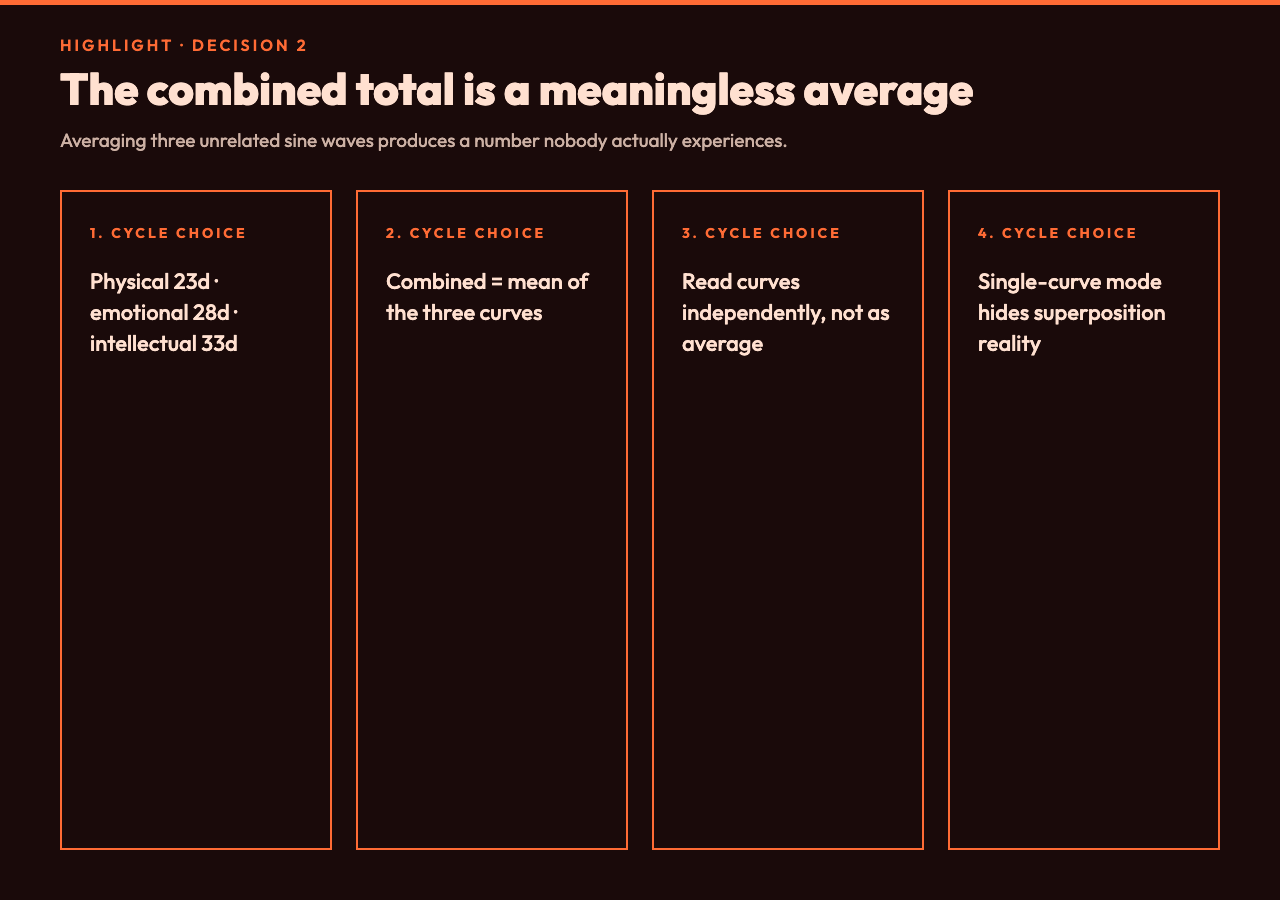
The classical biorhythm chart has three curves and one combined total. The combined total is the average of the three — and this is where most “the chart predicted my bad day” stories come from, because averaging three unrelated sine waves produces something that looks like a meaningful low-frequency wave but is actually just the result of superposition.
The three cycles are:
- Physical (23 days) — the shortest. Flips sign roughly every 11.5 days, so you hit a zero-crossing about twice a month.
- Emotional (28 days) — exactly four weeks. Flips sign every 14 days. This is also the lunar month, which is probably not a coincidence for the original theory’s 19th-century proponents, but is also not evidence.
- Intellectual (33 days) — the longest. Flips sign every 16.5 days, so the gaps between zero-crossings are wider and the curve drifts more slowly.
When you read “your combined biorhythm is at 23% today,” the tool is averaging those three numbers. If you happen to be at physical +80 and emotional -40 and intellectual +30, the average is +23 — which the chart labels “neutral.” But “neutral” as an average of “feeling great physically, low emotionally, sharp intellectually” is not a state anyone actually experiences. It’s a meaningless number.
The honest way to use a three-curve chart is to read the three curves independently and notice which one is moving in the direction you happen to be feeling. If the physical curve is in a deep trough and you have a scheduled leg day at the gym, the chart might be a reminder to lower the weight and focus on form. If the emotional curve is at peak and you’re about to send a difficult email, the chart might be a reminder to send it now before the next zero-crossing. But you don’t need a chart for either of those observations — you need a chart only if you want a consistent reference across days, which is where the date-precision decision from above starts to matter.
A second variant of this decision is whether to track all three curves or only one. Some biorhythm calculators let you hide two of the curves and only plot the one you care about. This produces a cleaner chart but it also produces a more dangerous illusion: a single sine curve has a regular pattern by construction, and “I see the pattern, therefore the pattern is real” is a logical fallacy. The pattern is real by definition — you drew a sine wave. The question is whether the sine wave tracks anything in your actual life, and the only way to know that is to compare it against a log you keep independently of the chart.
Decision 3: When is a “critical day” actually a critical day?
The original theory’s most quoted claim is the “critical day” — a day when one of the curves crosses zero. The theory says these are days of increased instability, accidents, or poor decisions. The chart marks them with dots and lists them as upcoming events. The math is straightforward: zero-crossings happen every period / 2 days, so physical gives you a critical day every 11 or 12 days, emotional every 14 days, and intellectual every 16 or 17 days.
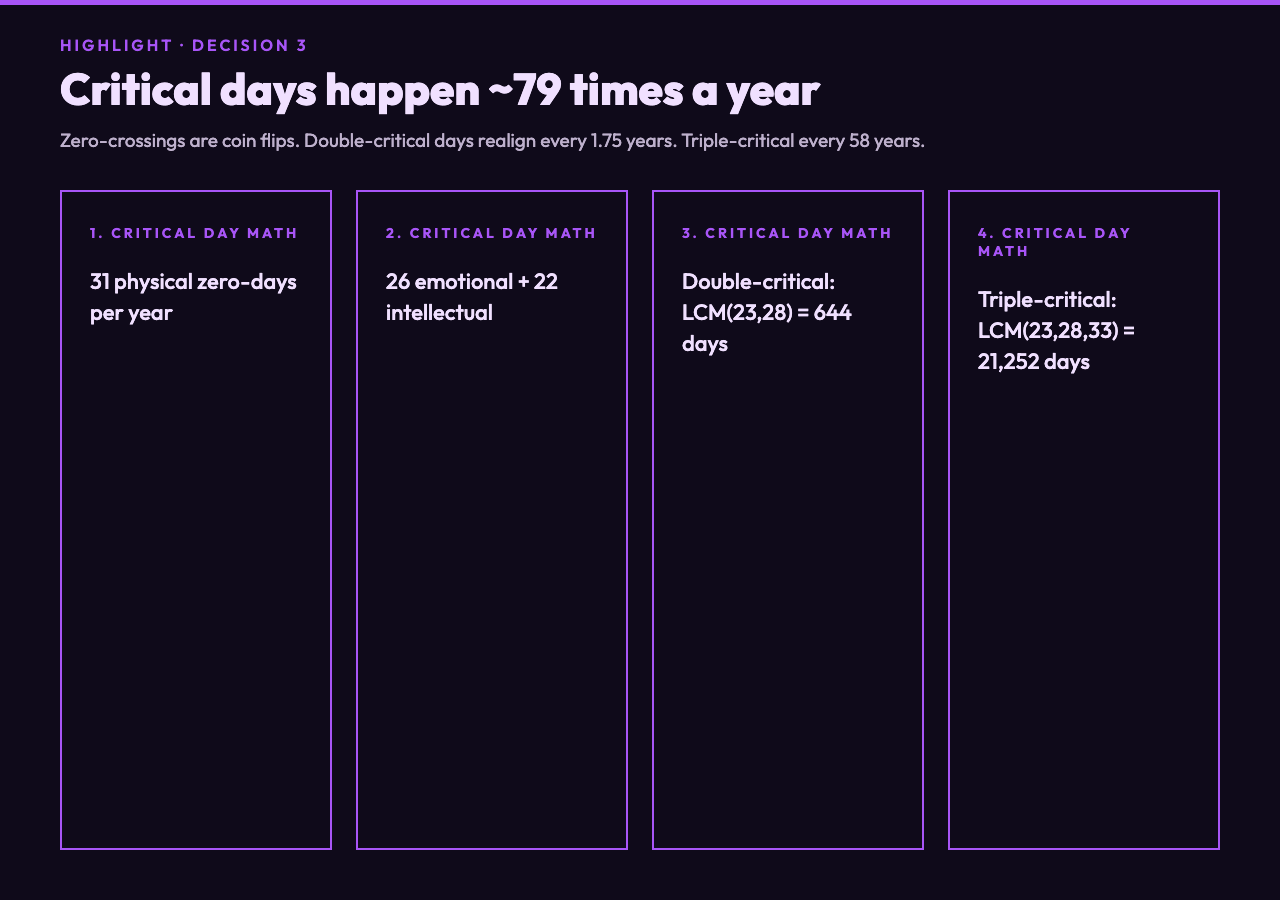
Add those up across a year. Physical contributes about 31 critical days per year, emotional about 26, intellectual about 22. Total: roughly 79 days a year when at least one of your cycles is at zero. The chance of any random day being a “physical critical day” is about 1 in 12 — meaning that on any given Tuesday, you have an 8% chance of being told by the chart that it’s a dangerous day for your body. That’s not a useful signal — that’s a coin flip with extra steps.
The “double critical day” claim, where two curves cross zero on the same date, is more interesting. Two cycles with periods 23 and 28 days go in and out of phase every LCM(23, 28) = 644 days — about 1.75 years. So roughly every 21 months you get a window where physical and emotional zero-crossings nearly coincide, producing a string of “double critical days.” This is the biorhythm theory’s equivalent of Mercury retrograde: a real arithmetic phenomenon (the cycles really do realign) that has no demonstrated correlation with anything in particular.
The triple-critical day — all three cycles at zero simultaneously — happens every LCM(23, 28, 33) = 21,252 days, which is just over 58 years. If you’re 30, you have a roughly 1-in-2 chance of seeing one in your lifetime. If you’re 60, you might have already missed yours. The chart will happily mark these days when they occur, but the theory doesn’t predict anything more dramatic on a triple-critical day than on a single-critical day. The visual emphasis (three zero-markers instead of one) does most of the persuasive work.
This is the decision that determines whether you find the chart useful as a thinking tool or as a prop. If you treat “critical day” as a flag worth investigating — “I had a real down day on March 14 and the chart said it would be — let me check if the math actually matched my log” — the chart is interesting. If you treat “critical day” as a prediction, you’re reading a sine wave as if it were a forecast, and you’ll be disappointed.
What the chart is actually good for
Strip away the predictive claims and a biorhythm chart is a clean visualization of three superimposed sine waves with adjustable phase, which is a useful shape to recognize. Once you understand what the chart looks like at the extremes (all three at peak, all three at trough, all three at zero, every combination in between), you start seeing the same pattern in unrelated domains — sleep cycle analysis, project planning, any time you’re trying to overlay multiple periodic processes on a single calendar.
For example: if you’re tracking sleep cycles for an upcoming trip across time zones, you already know the curve you want — a 90-minute cycle of light and deep sleep, anchored to your home time zone. Plotting that against the biorhythm chart is a useful sanity check: are you about to make a major work decision on a day when your sleep cycle is also in a trough? The biorhythm chart’s value here is not “physical cycle predicted bad sleep” — it’s “here is a clean way to overlay two cycles and look at them together.”
Or, more practically: if you keep a log of how you feel each morning on a 1-10 scale, plot your log against the chart’s intellectual curve for the same dates. The two will correlate on some days and diverge on others. The divergences are the interesting ones — they’re days when something other than the 33-day intellectual cycle is driving your state. The chart doesn’t tell you what that something is, but it gives you a clean visual contrast for noticing it.
Siblings worth pairing with this
A biorhythm chart reads better when paired with a more rigorous tracker. Sleep Cycle Calculator is the cleanest sibling: it overlays the 90-minute sleep-cycle phase on the same kind of daily-timeline view, so you can compare two independent periodic models on the same day. 4-7-8 Breathing Exercise is a useful complement on critical days — a four-second inhale, seven-second hold, eight-second exhale is a fixed-period pattern you can run any time, and the chart’s “physical cycle at zero” markers are a reasonable reminder to actually use it. Guided Meditation and Meditation Timer round out the cluster for the same reason — they all anchor you to a present-moment pattern instead of a future prediction. And the plotter itself is fast enough that you can regenerate the chart with different birth dates to see how sensitive the curves are to one-day input errors — a small experiment that takes about ten seconds and teaches more about the math than any reading of the original theory.
The honest summary: the chart’s math is real, the chart’s predictions are not, and the chart is a useful overlay tool once you know which of those two things you’re looking at. Open the plotter, pick a known date, read the three curves independently, and treat any “critical day” label as a footnote to investigate rather than a forecast to obey.