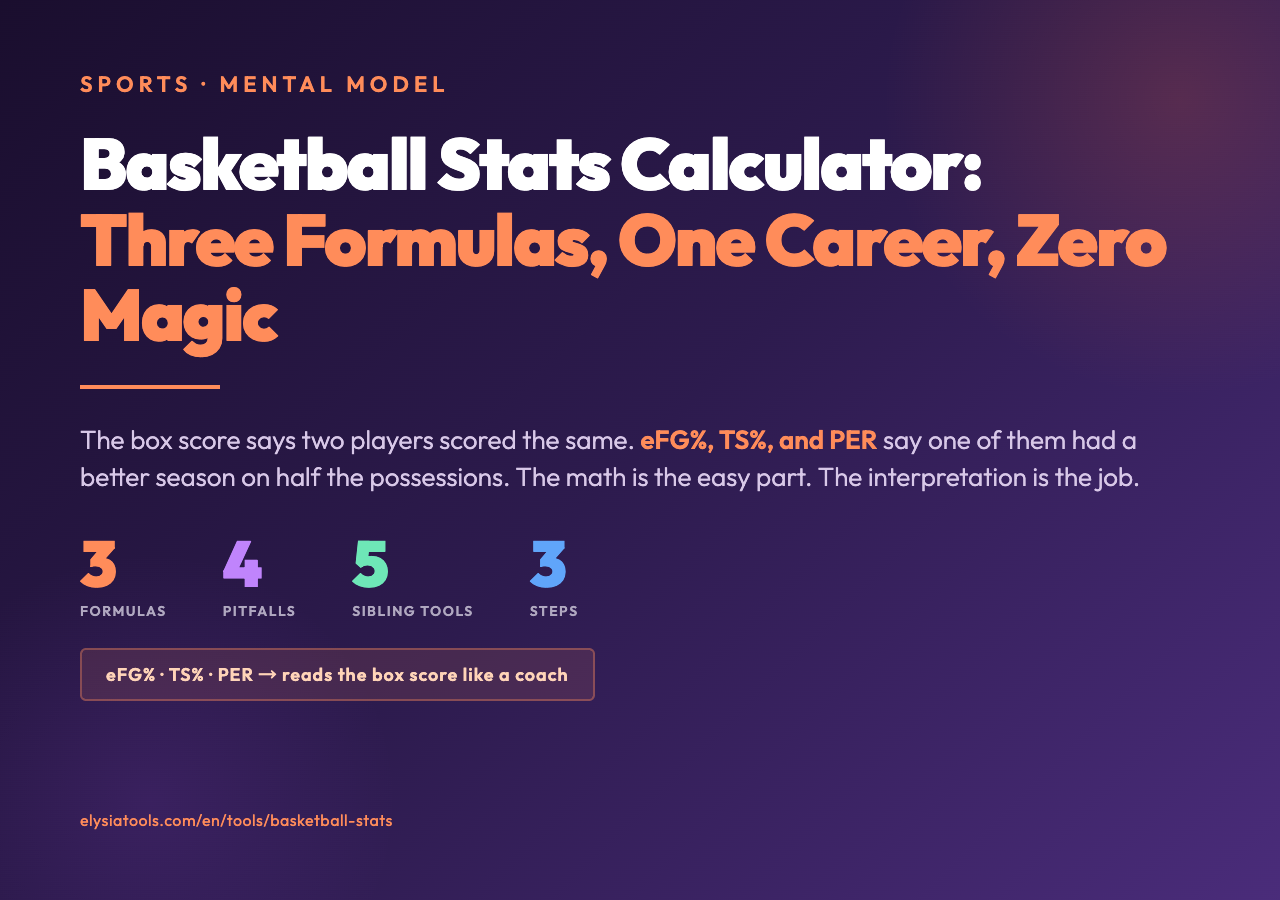
Two players score twenty points. One is a thirty-five-year-old shooting guard who spends the night chasing shooters around screens and finishing at the rim. The other is a nineteen-year-old center who scores fifteen in the paint and throws in a corner three. The box score says they did the same job. It did not. The Basketball Stats Calculator on Elysia Tools is built for the second look — the one that separates volume from value, and the box score from the actual season.
This article walks through the three formulas the calculator runs by default (true shooting percentage, effective field goal percentage, and player efficiency rating), explains why each one exists, and shows where they break when the game gets weird. The mental model you want at the end is not “this tool computes stuff.” It is “the box score is a frame, and these three numbers redraw the frame so it actually fits the player.”
Why the box score lies (and why three numbers fix it)
Raw counting stats — points, rebounds, assists, steals, blocks, turnovers — are the easiest basketball numbers to record, and the easiest to misread. Twenty points in fifteen shots is not the same season as twenty points in twenty-five shots. Six assists in a slow half-court offense is not the same season as six assists in a fast-paced team that runs every possession. The box score cannot tell the difference. Three derived statistics can, and the calculator computes all three side by side so you can compare two players without doing the arithmetic by hand.
The three formulas come from three different questions about the same player. Effective field goal percentage asks, “how much damage does each shot do?” True shooting percentage asks, “how much damage does each possession do?” Player efficiency rating asks, “how much did this player contribute per minute, on both ends of the floor?” They overlap but they are not redundant. A player can crush eFG%, look fine on TS%, and collapse on PER because he never rebounds, never defends, and never passes.
The formulas in plain English
Effective field goal percentage (eFG%) adjusts field goal percentage to account for the fact that a three-pointer is worth one and a half times a two-pointer. The formula is (FGM + 0.5 × 3PM) / FGA. A player who shoots 6-of-10 from three and 0-of-10 from two has eFG% of 60%, even though his raw FG% is 30%. Same number of makes, wildly different value.
True shooting percentage (TS%) goes one step further and folds in free throws. The formula is PTS / (2 × (FGA + 0.44 × FTA)). The 0.44 coefficient estimates the number of possessions a trip to the line actually consumes (most players shoot two free throws on a foul, but and-ones and technicals shift the average). A high-volume free-throw shooter can post a TS% above 70% even with a mediocre eFG%, because every trip to the line is uncontested offense.
Player efficiency rating (PER) is John Hollinger’s all-in-one number. It weights positive contributions (points, rebounds, assists, steals, blocks) against negative ones (missed shots, turnovers, fouls), scales by pace, and outputs a single number where fifteen is average and thirty is MVP-territory. PER rewards everything — a player who scores, rebounds, passes, and defends will post a higher PER than a scorer who only scores. The trade-off is that PER is complex, requires minutes played, and is sensitive to pace assumptions. The calculator uses a standard league-average baseline so two players from different teams compare cleanly.
Reading the calculator output
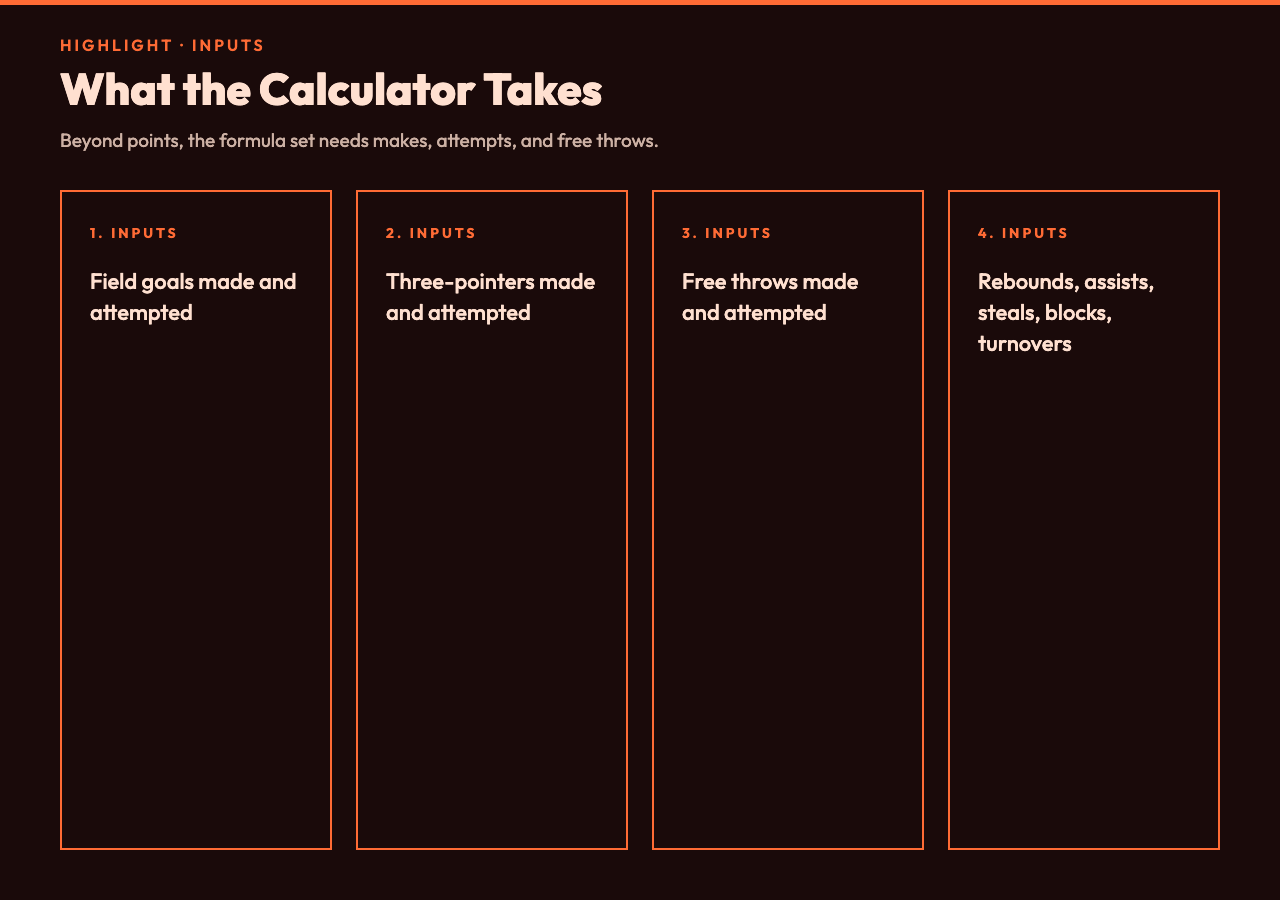
Type a player’s name and the calculator pre-fills league-average rates as a starting point. Each input takes points, rebounds, assists, steals, blocks, turnovers, field goals made and attempted, three-pointers made and attempted, and free throws made and attempted. Minutes played is optional but recommended for PER. Once you tab out, the three derived stats appear below the input grid with a one-line interpretation in plain English.
The interpretation matters as much as the numbers. A 60% TS% does not mean the same thing on a center who takes ten shots per game as it does on a guard who takes twenty-five. The calculator surfaces that gap by listing shot volume next to efficiency, so you can see whether the player got there on three contested layups or twenty pull-up threes. Two different seasons, same efficiency number.
Where each formula breaks
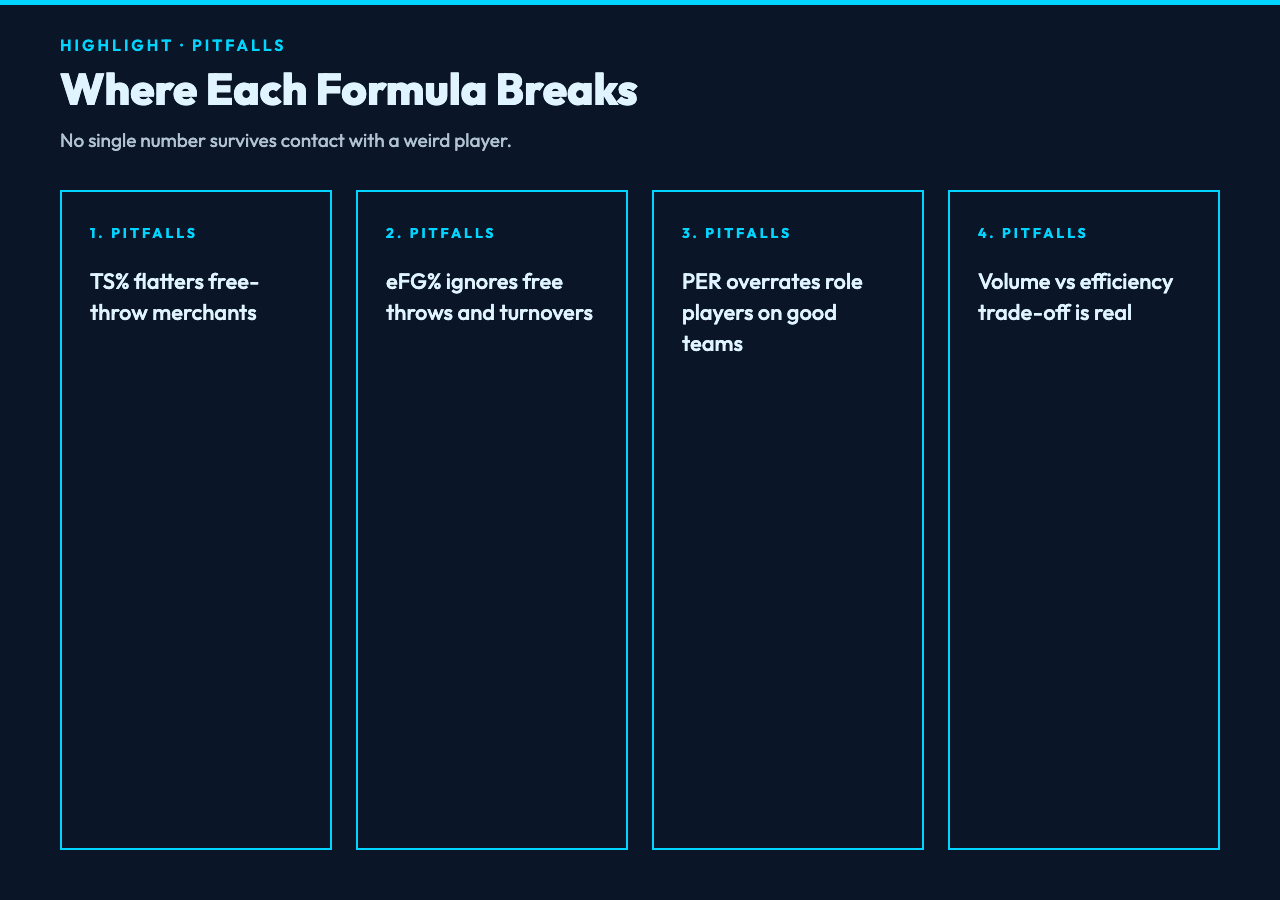
No single stat survives contact with a weird player. Here is where the three formulas start to lie, and how to read past the lie.
True shooting flatters free-throw merchants
A player who shoots 90% from the line and gets fouled a lot can post a TS% that overstates his on-ball shot creation. Trae Young’s career TS% is elite partly because he draws fouls at a top-ten rate and converts at the line. If you only watched his TS%, you’d think he was a more efficient scorer than players who score the same number of points on contested jumpers. The fix is to look at eFG% alongside TS%: when TS% is much higher than eFG%, free throws are doing the work.
Effective field goal ignores free throws and turnovers
A player who shoots 55% from two on low volume and never gets to the line has a respectable eFG% but a low TS% because every miss is a wasted possession with no foul-drawing fallback. The split between eFG% and TS% is itself a signal: it tells you how much of the player’s offense depends on creating fouls. Big gap, lots of foul-baiting. Small gap, balanced shot diet.
PER overrates role players on good teams
PER is pace-adjusted but not teammate-adjusted. A center on a top-three defense will post a higher PER because steals and blocks inflate against weak offensive opponents. The number is real — those stops are real — but the gap between the player’s PER and his on-off defensive impact can be larger than the gap appears. Pair PER with on-off splits or RAPM if you have them. For a quick read, PER is fine. For a precise read, you need lineup data.
Working examples: three players, three readings
The way to use the calculator is not to plug in one player and trust the output. The way is to plug in two players and compare what each formula says about the gap. Three worked examples illustrate the pattern.
Case 1 — High-volume scorer vs. high-efficiency role player. Player A: 28 PPG on 22 FGA, 6 FTA, 5 RPG, 5 APG. Player B: 14 PPG on 9 FGA, 4 FTA, 7 RPG, 2 APG. The box score says Player A is twice as valuable. The calculator says Player B’s TS% is 65% versus Player A’s 58%, and Player B’s PER is 22 versus Player A’s 19. Player B is doing more per possession. Player A is doing more total. Both can be true.
Case 2 — Three-point specialist on a slow team. A stretch four who takes 8 threes per game, makes 42% of them, scores 18 PPG, rebounds 6, and assists 2. His eFG% is 65%, his TS% is 64% (no free throws), his PER is 17. By every formula he is a high-impact role player. The trap: those numbers assume the team gets him the ball in rhythm. If he is creating most of his own threes off the dribble, the supporting cast matters more than the formula suggests.
Case 3 — Big man who scores inside only. A center who takes 12 shots per game, makes 60%, scores 16 PPG, rebounds 11, blocks 2, and turns it over twice. His eFG% is 60% (no threes to boost), his TS% is 62% (some free throws), his PER is 21. On raw PER he looks like a star. On context — twelve shots in the modern NBA is a low-usage role, and the team may be running the offense through him inefficiently — those numbers overstate his on-court value. PER is one input, not a verdict.
Pairing the calculator with other Elysia Tools
Basketball stats live next to stats in every other sport, and the same mental model — volume vs. efficiency, raw counting vs. derived rate — applies across leagues. The Baseball Statistics Calculator runs the same comparison using batting average, on-base percentage, and slugging percentage. The Football Stats Calculator applies the same framing to yards per attempt, completion percentage, and quarterback rating. The Bowling Score Calculator handles the simpler case of one bowler at a time. Each tool surfaces the same trade-off: raw counting stats are easy to record but misleading to compare, and one or two derived rates are usually enough to redraw the comparison.
For pure probability questions (what is the chance this player hits his next three?), the Dice Probability Calculator covers the math. For strength-sport comparisons across weight classes, the Wilks Score Calculator runs the same kind of cross-category adjustment that PER applies to minutes and pace. The through-line is the same: a single number is rarely fair across categories, and a calculator that surfaces the underlying inputs is usually more honest than one that hides them behind a verdict.
Three steps to use the calculator well
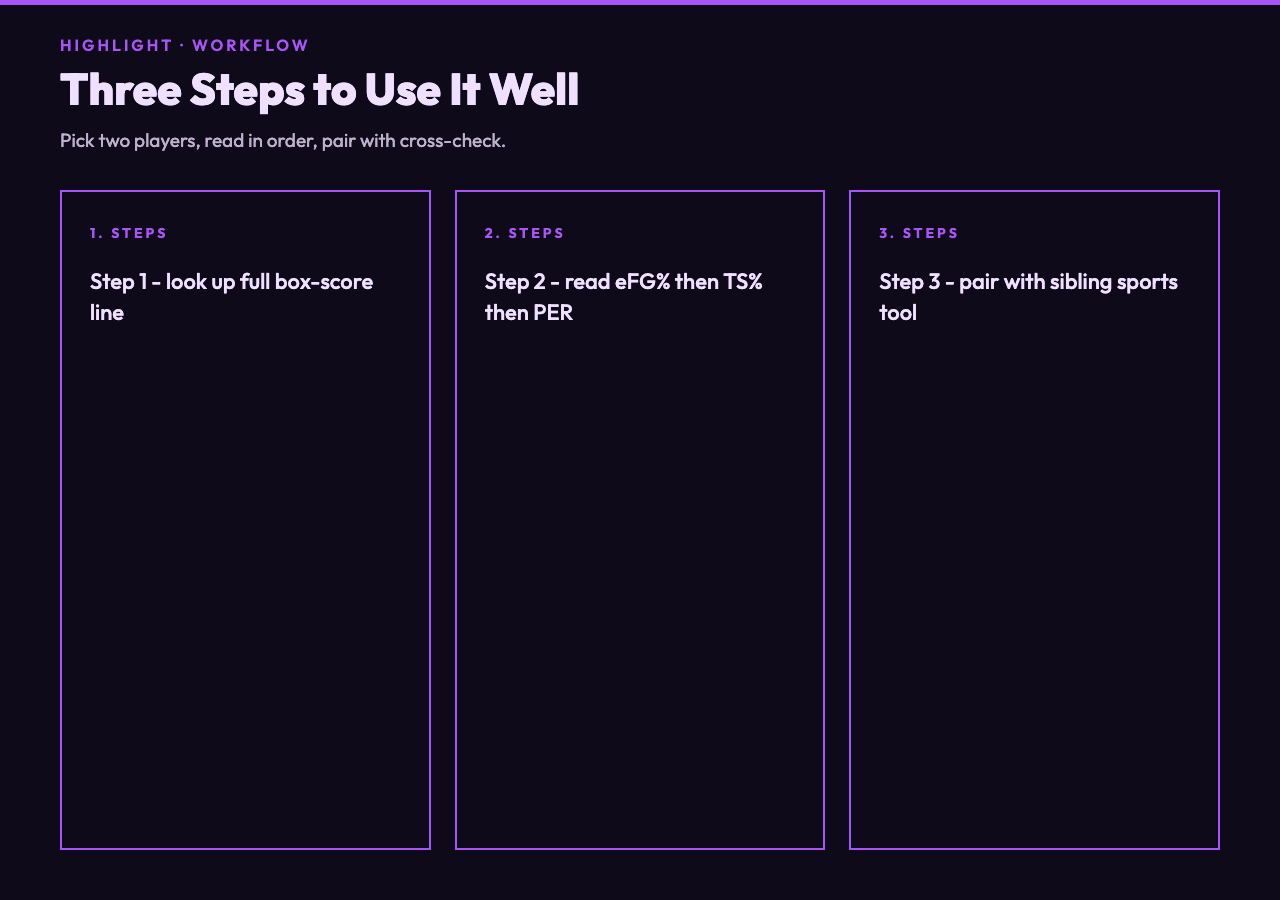
Step one — pick two players you want to compare, and look up their full box-score lines (not just points). The calculator needs makes, attempts, three-pointers made, free throws made and attempted, rebounds, assists, steals, blocks, and turnovers. Anything you leave blank defaults to zero, which silently skews the result.
Step two — read the three derived stats in order. eFG% first because it has the cleanest interpretation (how much damage per shot). TS% second because it adds free throws and tells you whether the player is creating fouls. PER third because it is the catch-all and the most sensitive to garbage-time minutes and pace.
Step three — pair the calculator with at least one cross-check. If PER and TS% disagree by a lot, one of the inputs is probably wrong (most often, missed free throws). If eFG% and TS% disagree by a lot, free throws are doing most of the work. If PER is high and TS% is mediocre, the player is contributing in ways the box score does not price (rebounds, defense, assists) — or the inputs are missing defensive plays the box score did not record.
Putting it together
The Basketball Stats Calculator is a small tool with a narrow job: take a box-score line and produce three derived statistics that survive the worst misreadings of raw counting stats. It is not a scouting report. It does not know the playbook, the matchup, or the defensive scheme. What it does is remove the arithmetic step from the comparison, so the only thing left to argue about is which formula fits the question. For most comparisons, eFG% + TS% is enough. For season-long or career comparisons, add PER. For context the formulas cannot see, watch the games.
Try it on a player you watched last night and one you have never seen, then run both numbers through the calculator here. The gap between what the box score implied and what the three formulas say is usually the interesting part of the comparison, and the part the box score was never going to show you.
Explore more tools at elysiatools.com.