
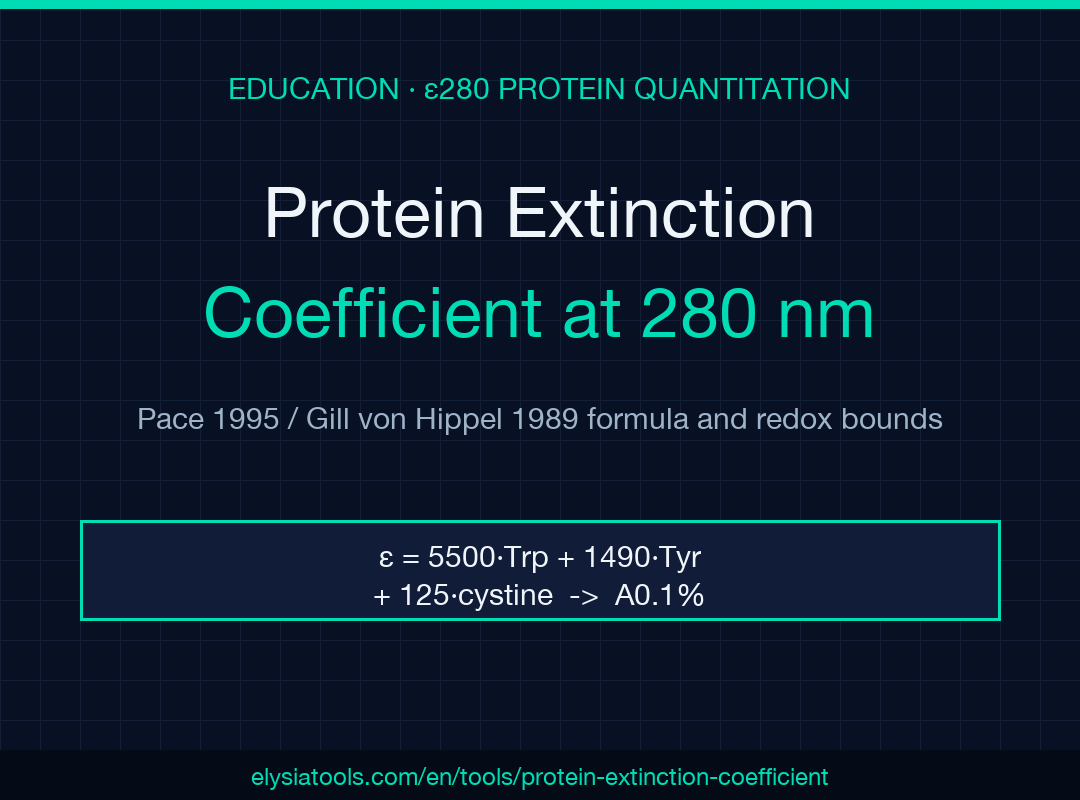
Pull a peptide’s ε280 from its sequence, then read the A0.1% off the same line — both numbers come out of one walk through the W/Y/C residues, and the redox-bound alone decides whether your Bradford calibration is over- or under-reporting by 4–8 percent. That single arc — sequence to ε to A0.1% to concentration from A280 — is what the Protein Extinction Coefficient Calculator is built for, and it lines up cleanly with the canonical Pace 1995 / Gill & von Hippel 1989 values most protein-science labs already use in their notebooks.
The one-line formula, and where each coefficient comes from
The arithmetic is one equation with three terms:
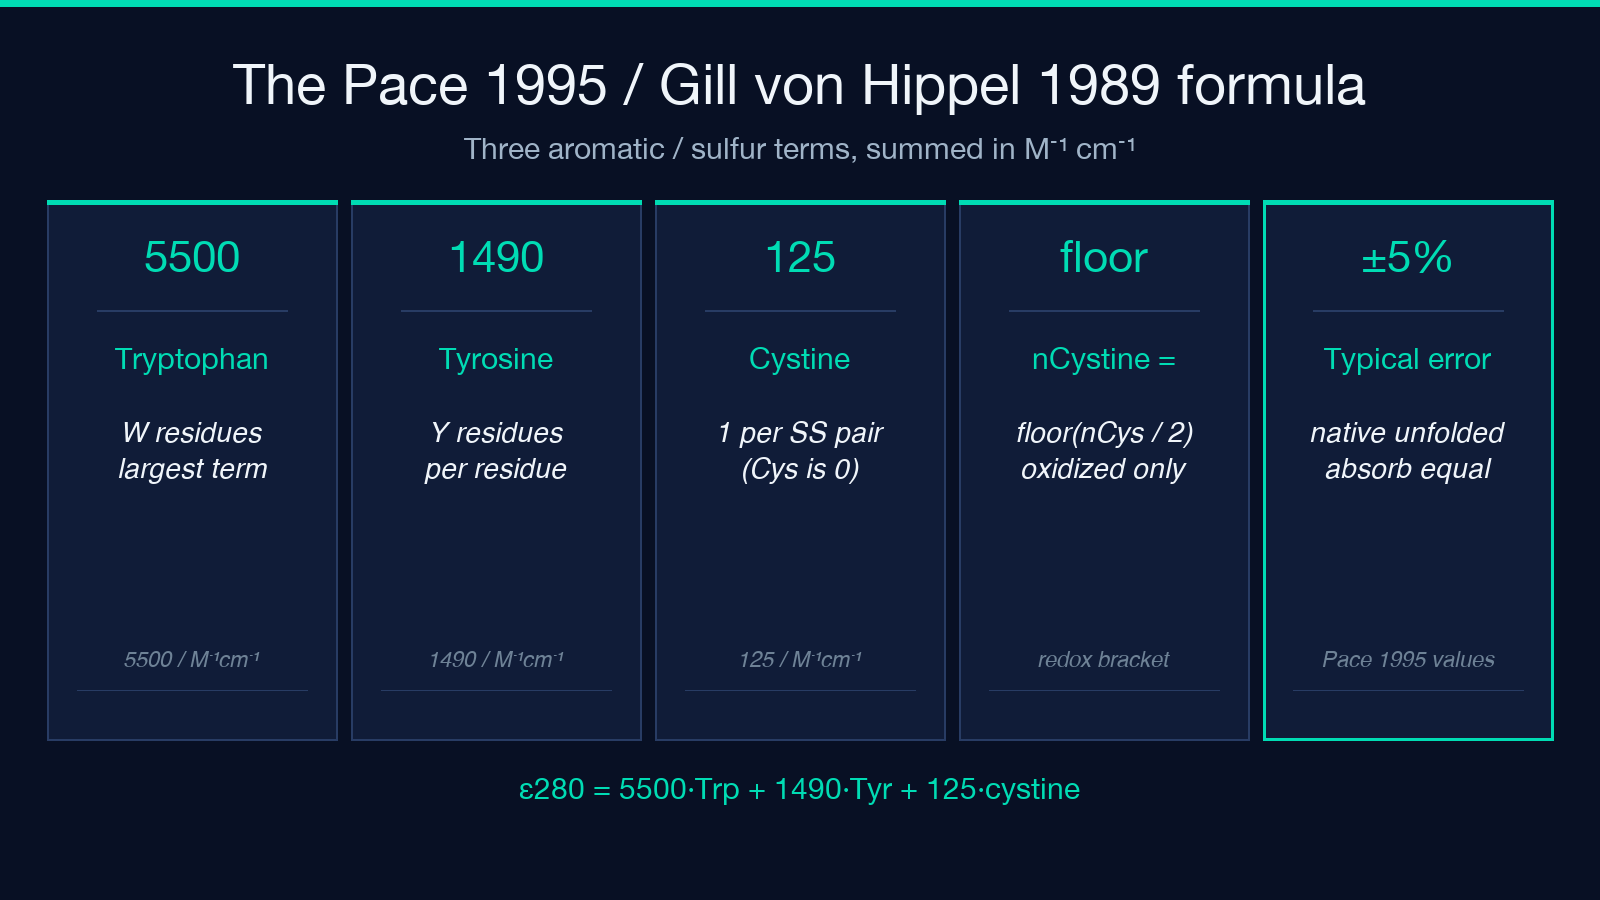
ε280 (M⁻¹ cm⁻¹) = 5500 × nTrp + 1490 × nTyr + 125 × nCystine
The 5500 / 1490 / 125 numbers are the Pace et al. 1995 compilation of model-compound absorbances for tryptophan, tyrosine, and disulfide-paired cystine. The Gill & von Hippel 1989 paper is the analytical derivation they cross-validate against; ExPASy ProtParam implements essentially the same recipe on top of residue masses plus H₂O. A “cystine” here is two cysteines joined by a disulfide bond, so an unpaired cysteine contributes nothing — and nCystine = ⌊nCys / 2⌋ is the floor a redox-unknown sample can safely bracket. Accuracy is typically within ±5 percent for native-like folded proteins; unfolded chains absorb the same, which is why denaturants in the cuvette don’t perturb the number.
Sequence mode versus count mode — when each one earns its keep
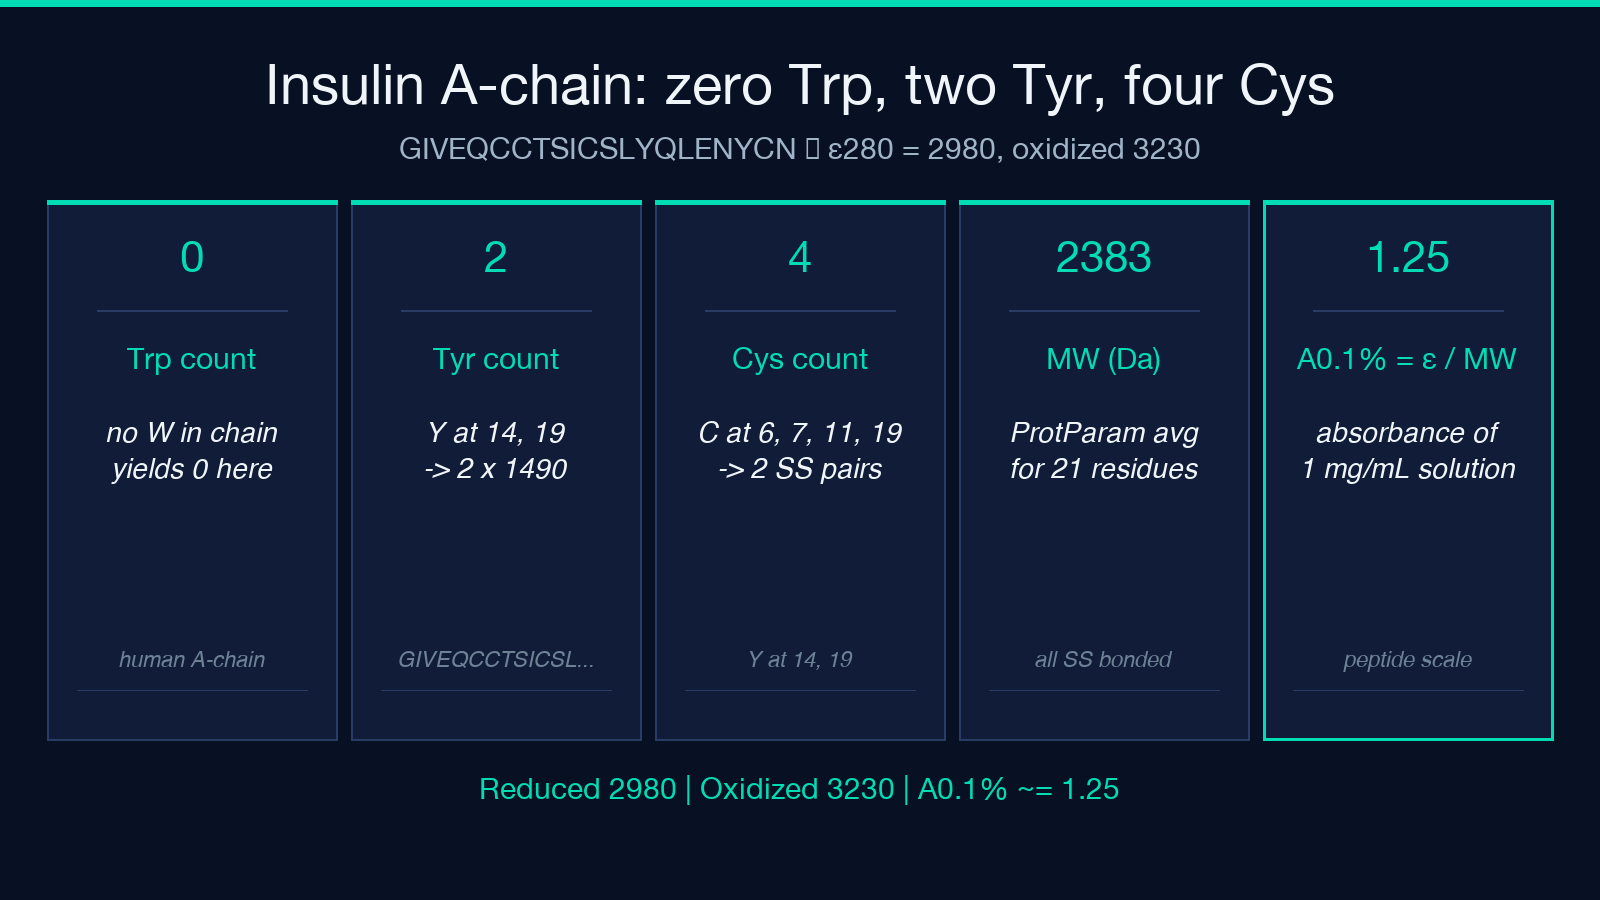
Sequence mode walks the one-letter string, tallies W / Y / C, and computes the ProtParam-style average molecular weight on the fly so A0.1% comes out without a second pass. The 21-residue insulin A-chain GIVEQCCTSICSLYQLENYCN is the canonical sanity check: 0 Trp, 2 Tyr, 4 Cys, all reduced → ε280 = 2980, oxidized bound 3230, A0.1% ≈ 1.25 for the 2383.71 Da chain. Count mode is the right tool when you already know the residue counts from a different pipeline — say a codon-aware amino acid composition report — or when you’re working with a synthetic peptide where you trust the spreadsheet more than the sequence. The two modes converge when the sequence is right and the counts are right; the gap between them is almost always an off-by-one in W or Y.
Cysteine redox: the bracket you can’t skip
A single sample rarely gives you a clean answer for cystine content. The tool returns both endpoints — all reduced and all oxidized — so the working range is ε_reduced ≤ ε_actual ≤ ε_oxidized. For insulin A-chain that’s 2980 to 3230, an 8 percent spread. For a 12-Cys antibody fragment it can be 25 percent. A reducing agent (DTT, TCEP, β-mercaptoethanol) plus alkylation (IAM, NEM) before A280 will collapse the range; if you can’t reduce in place, report both bounds and let the downstream titer calculation inherit the uncertainty. Pair this with a Bradford assay or BCA assay when the redox state is ambiguous — the dye-based methods sidestep the ε280 question entirely, at the cost of an inter-assay CV around 10–15 percent.
A0.1% — the per-milligram number Bradford actually wants
A0.1% = ε / MW is the absorbance of a 1 mg/mL solution in a 1 cm path. It’s the same number on the label of every commercial BSA lot and the reason your nanodrop, your Bradford standard curve, and your published extinction coefficient agree without conversion. The calculator returns A0.1% alongside ε whenever it has a sequence (or an explicit MW in count mode) — for insulin A-chain that’s 1.25, for lysozyme C it’s 2.63, for a typical IgG around 1.4. Working in A0.1% is the cleanest way to compare two preparations of the same protein across purification steps; working in ε is the cleanest way to compare two different proteins.
Beer-Lambert sanity check and the path-length trap
Concentration from A280 follows directly: c (M) = A280 / ε for a 1 cm cuvette, c (mg/mL) = A280 / A0.1% for any path length once you’ve normalized. The path-length trap is the most common silent error: a 0.1 cm peek-through on a NanoDrop-style pedestal gives ten times the apparent concentration if you forget to switch the path length factor. Most modern instruments encode the path-length correction themselves; if yours doesn’t, divide the raw A280 by the actual path in cm before plugging into the formula.
When ε280 is the wrong tool entirely
Three classes of sample return near-zero ε280 and will silently mislead anyone who trusts the number:
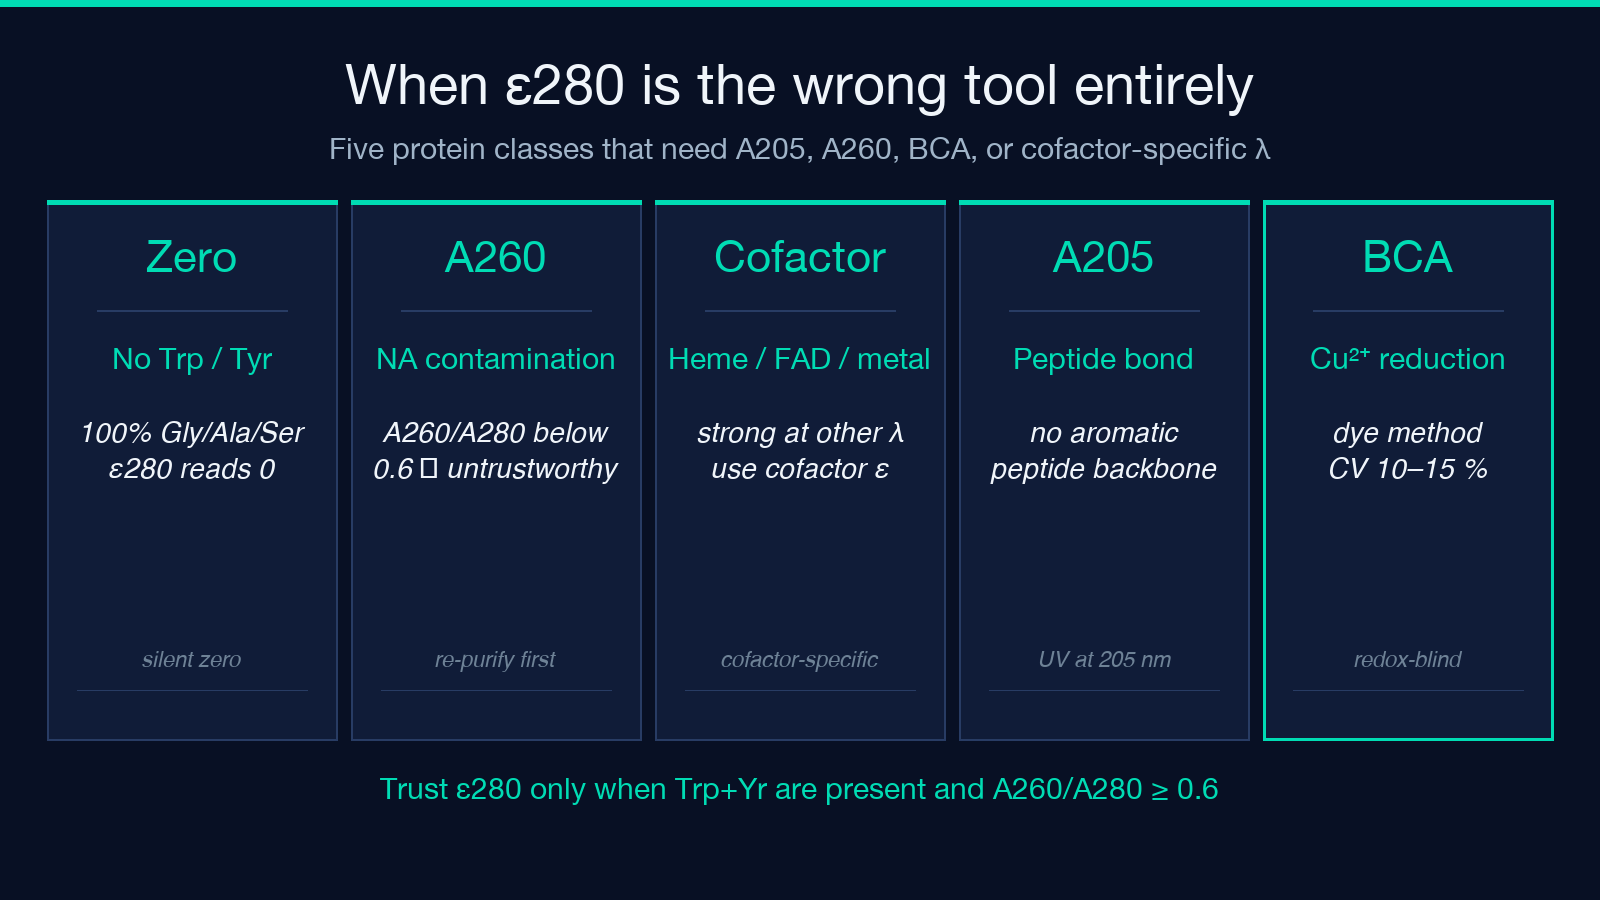
- – Proteins with no Trp and no Tyr. A 100-percent-Gly/Ala/Ser construct reads ε280 = 0 even though the protein is real and at meaningful concentration. Use A205 (peptide bond absorbance) or BCA in this regime.
- – Nucleic-acid-contaminated preps. DNA contributes strongly at 260 nm and somewhat at 280 nm; a prep with an A260/A280 of 0.6 or less is unreliable for ε280 quantitation. The cleanest fix is the A260/A280 ratio check first; if it’s out of range, re-purify before quantitating.
- – Strongly chromophore-bound cofactors. Hemoproteins (heme ε at 280 ≈ 0), flavoproteins, and many metalloproteins need their cofactor-specific wavelength and an independently measured extinction coefficient. Cross-reference against the protein calculator only as a coarse sanity check, not as a final answer.
Cross-validating against other quantitation routes
When you have a sequence and a clean prep, the protein concentration converter is a quick unit-switcher between mg/mL, μM, and nmol — pair it with the ε280 number to get the absolute molar titer in one step. For a peptide instead of a folded protein, the peptide mass calculator gives the monoisotopic mass you need for the A0.1% calculation when the sequence doesn’t round-trip cleanly. When the protein is an enzyme you’re assaying, fold the molar concentration into the enzyme activity unit calculation to convert U/mL into U/mg without a hand-typed denominator.
What to record so the next person can reproduce it
The minimum reproducible record is four numbers and one flag: ε280 (with reduced/oxidized state), A0.1%, MW used, sequence mode vs count mode, and whether you corrected for nucleic-acid contamination. Anything less and the titer stops being comparable across preps. Live values from the Protein Extinction Coefficient Calculator and a worked insulin-A-chain example walk through are at elysiatools.com — the same numbers will reproduce inside your notebook today and in the audit trail six months from now.
