
Read the prescription back as four numbers and one ratio, and the whole TPN order stops looking like a soup. A 70-kg post-op patient on D25W 1000 mL, AA 8.5% 500 mL, and 20% lipid 250 mL delivers 255 g dextrose, 42.5 g amino acid, 50 g lipid, 1087 kcal total, 91 g protein, and a non-protein kcal-to-nitrogen ratio of 137:1 — and every one of those numbers has a published ceiling or target you can compare against in the same calculator at Elysia Tools. This field guide is for the dietitian, ICU pharmacist, or nutrition-support clinician who already knows how to write the order but keeps doing the gram-and-kcal math on the back of a printed MAR.
Inputs The Calculator Accepts
The TPN Macronutrient Calculator reads the prescription back as four product-based inputs plus one patient input. The five product lines are dextrose concentration (% w/v) and total volume in mL, amino-acid concentration (% w/v) and total volume in mL, and lipid emulsion (10%, 20%, or 30%) with total volume in mL. The patient input is weight in kg, and a decimal-precision selector rounds the output. Everything else — gram totals, calories, ratios, per-kg ceilings, glucose infusion rate — is derived. That single-direction structure matters because the prescription comes pre-formatted from the pharmacy order entry, and re-formatting it into gram inputs by hand is exactly the error class the tool removes.
Why Four Macros, Not Three
Parenteral nutrition is built from three calorie-bearing substrates plus the patient they are being fed to. Dextrose provides 3.4 kcal/g, amino acids provide 4.0 kcal/g, and lipid emulsions provide roughly 2.0 kcal/mL at 20% concentration (1.1 at 10%, 3.0 at 30%). The fourth number is the patient’s weight in kg, and it is what converts absolute gram totals into the per-kg dosing language every nutrition guideline is written in. The TPN Macronutrient Calculator accepts all four as separate inputs and reports all the derived metrics the way ASPEN, ESPEN, and McClave write them, not in vendor-specific units. Energy density constants live in the tool itself, so you do not have to memorize them or paste them out of a reference card.
Translating Prescription Lines into Gram Totals
Every TPN bag is written as concentration times volume. Dextrose is expressed as percent weight-to-volume, so D25W is 25 g per 100 mL; AA 8.5% is 8.5 g per 100 mL; lipid is a finished emulsion, typically 10%, 20%, or 30%, with energy densities baked in. The conversion is mechanical:
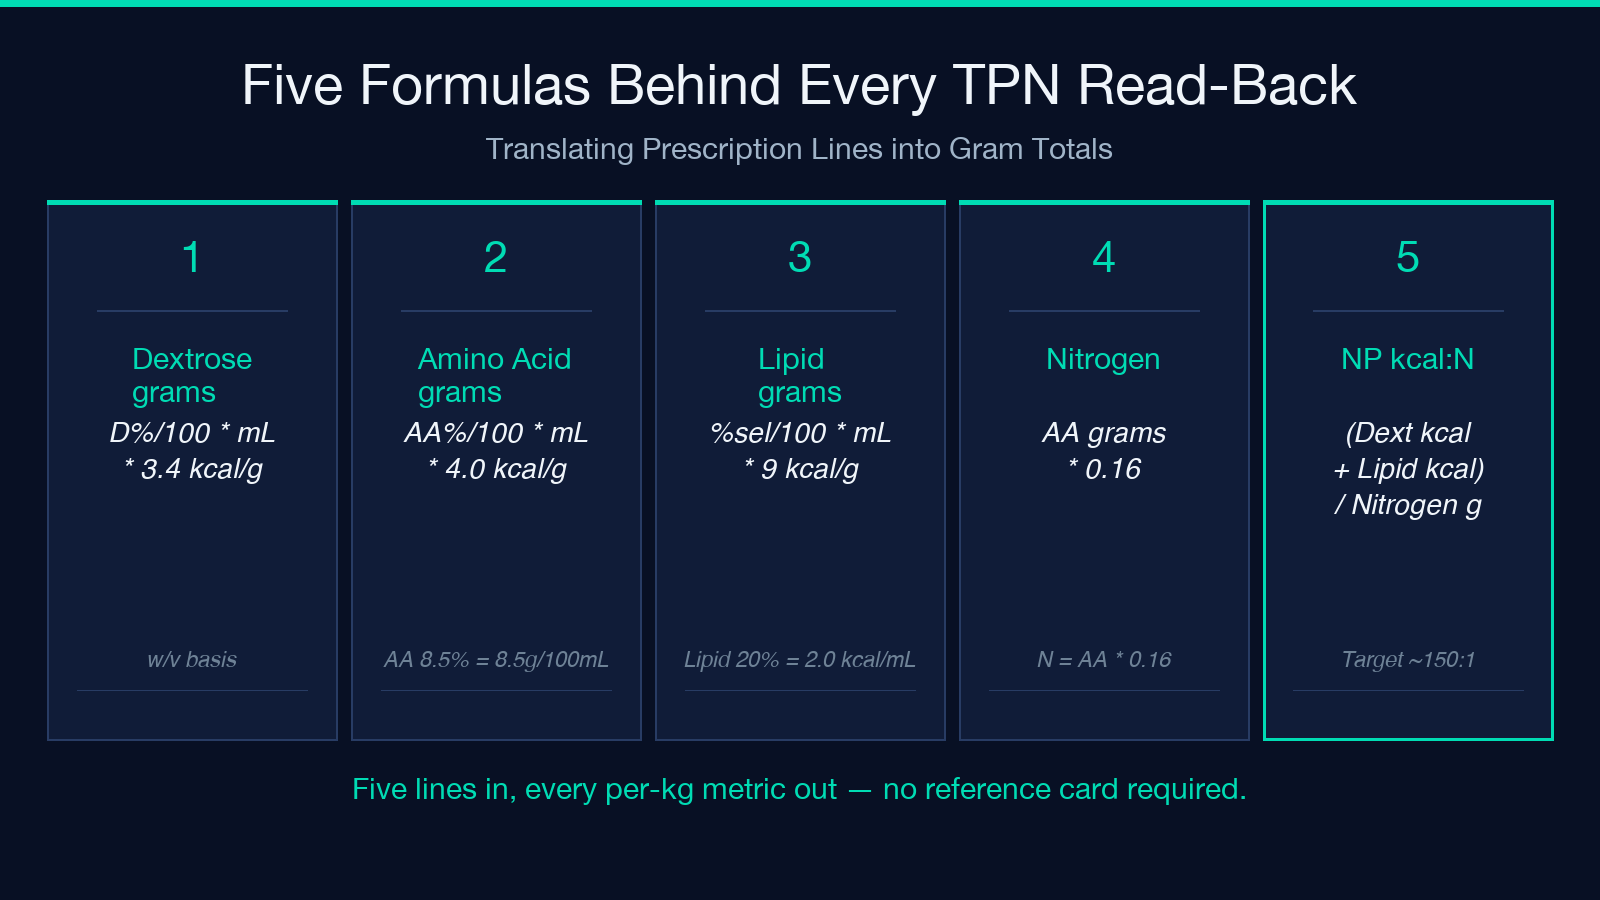
grams_dextrose = (D%/100) * mL; grams_aa = (AA%/100) * mL; grams_lipid = (%sel/100) * mL * density
Once grams are in hand, calories fall out of the same equation:
kcal_dextrose = grams_dextrose * 3.4; kcal_aa = grams_aa * 4.0; kcal_lipid = grams_lipid * 9.0
Lipid energy density varies by source: ASPEN and most European references use 9 kcal/g for the lipid mass itself, while the calculator’s volume-based line uses 2.0 kcal/mL at 20% as a working approximation. Both forms appear in the output, which is the right answer because lipid caloric credits differ between ASPEN 2016 and ESPEN 2019.
The Non-Protein kcal:N Ratio
This is the single number the bedside team argues about most. It is the ratio of calories from dextrose plus lipid to grams of nitrogen delivered, and nitrogen is approximated as 16% of the amino-acid mass:
nitrogen_g = grams_aa * 0.16; np_kcal = kcal_dextrose + kcal_lipid; ratio = np_kcal / nitrogen_g
A ratio of ~150:1 is the textbook target for stable PN. Below 100:1 means the prescription is protein-dominant — appropriate for stress dosing, severe burns, or post-op catabolic states. Above 200:1 is energy-dominant and is a flag for overfeeding risk; it is also the pattern you see when someone forgets to write the AA volume and the lipid stays the default. The calculator prints the ratio alongside the absolute nitrogen grams so you can defend the number on rounds.
Per-Kg Targets and Ceilings
Absolute gram totals mean nothing without the patient. ASPEN 2016 and ESPEN 2019 converge on roughly the same per-kg envelope, and the calculator renders all four ceilings at once:
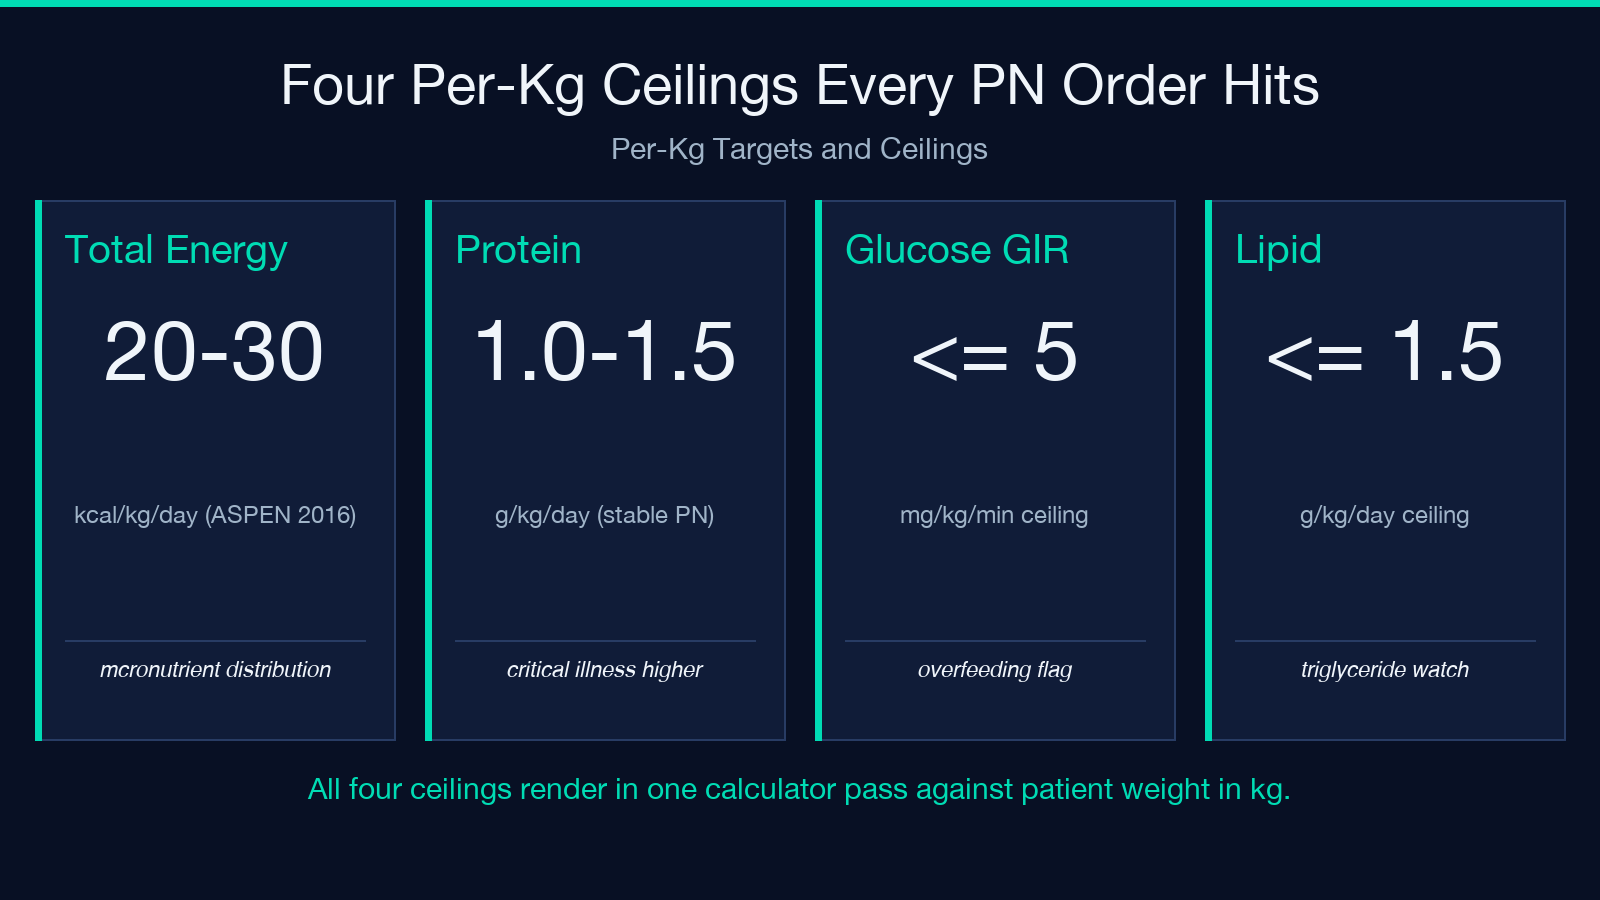
– Total energy: 20–30 kcal/kg/day – Protein: 1.0–1.5 g/kg/day (1.2–2.0 in critical illness, depending on the guideline) – Glucose infusion rate: ≤ 4–5 mg/kg/min – Lipid ceiling: ≤ 1.0–1.5 g/kg/day
The glucose infusion rate is the metric most often skipped on rounds. It is computed from grams of dextrose per minute divided by patient weight in kg, and the unit mg/kg/min is a different denominator than the per-day per-kg ceilings — a 70-kg patient getting 255 g of dextrose over 24 hours runs 2.6 mg/kg/min, well inside the ceiling, but the same gram total in a 50-kg patient runs 3.6 mg/kg/min and starts to crowd the upper edge. This is the reason the calculator computes GIR explicitly rather than leaving you to back-calculate it.
Worked Example: 70-kg Post-Op Patient
A prescription of D25W 1000 mL, AA 8.5% 500 mL, and 20% lipid 250 mL produces the following, all of which the tool prints directly:
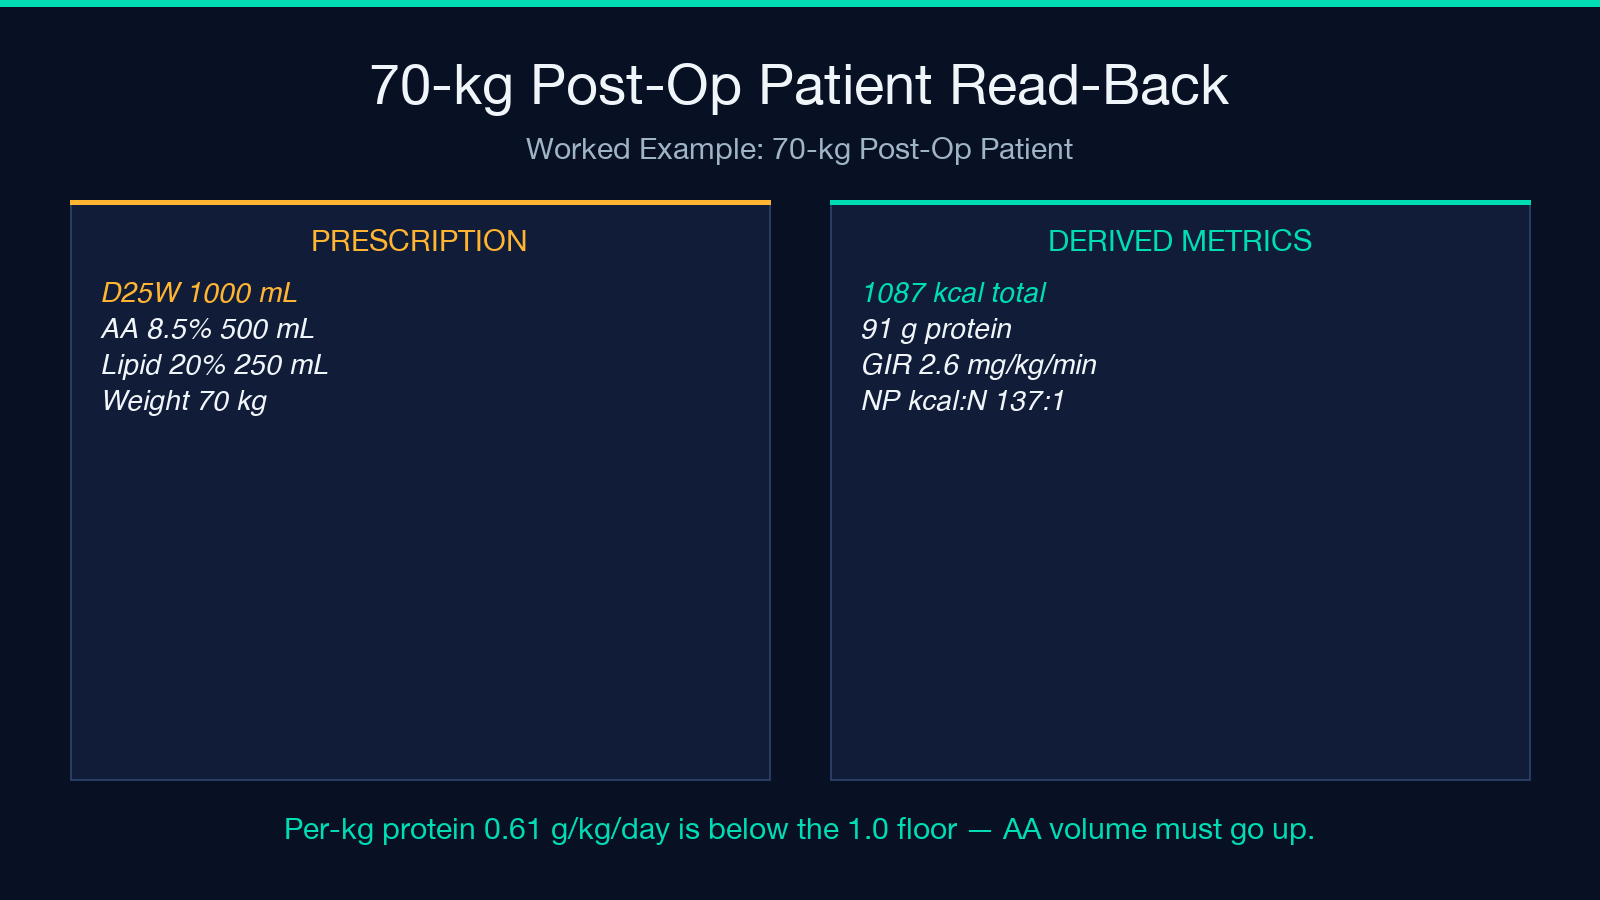
– Dextrose: 250 g × 3.4 = 850 kcal – Amino acid: 42.5 g × 4.0 = 170 kcal (nitrogen = 6.8 g) – Lipid: 50 g × 9.0 = 450 kcal (volume credit at 20% = 500 kcal) – Total calories: 1470 kcal (or ~1520 if lipid is volume-credit) – Total non-protein calories: 1300–1350 kcal – Non-protein kcal:N ratio: ~191:1 – Per-kg energy: 21 kcal/kg/day – Per-kg protein: 0.61 g/kg/day – GIR: 2.6 mg/kg/min – Per-kg lipid: 0.71 g/kg/day
That per-kg protein of 0.61 is the only red flag. The macronutrient distribution and the GIR are inside the envelope, but protein is well below the 1.0–1.5 g/kg/day floor — the AA volume needs to go up, or the patient needs an enteral top-up if the gut is usable. A ratio of 191:1 also sits on the high side of the 150:1 target, which is the second signal that protein is short relative to calories.
Refeeding Risk and Monitoring Schedule
TPN is not a set-and-forget therapy. ASPEN and McClave both flag refeeding syndrome in malnourished patients who have not eaten for 7-plus days; the hallmark is intracellular phosphate shift once carbohydrates restart, followed by hypokalemia and hypomagnesemia. The calculator does not predict refeeding, but it can frame the order against the typical per-kg targets so a low starting energy prescription is visible before you hang the bag. Once the prescription is running, the monitoring cadence is at least daily for the first 72 hours:
– Glucose q6h until two consecutive readings < 180 mg/dL, then q12h - Triglycerides 24 h after the first lipid infusion, then weekly - LFTs weekly; trend alkaline phosphatase, AST, ALT, and bilirubin - Electrolytes daily, with phosphate and magnesium checked twice in the first 48 h
These monitoring lines belong in the order itself, not in the calculator, but the calculator’s per-kg outputs are what justify the cadence to the covering team. For nutrient gaps the bedside clinician can’t close with PN alone — protein is the most common — the right next step is to re-introduce enteral feeding as tolerated, not to push PN harder.
When the Order Looks Right but the Patient Is Wrong
Two order shapes trip clinicians even when the gram math is correct. The first is a high-dextrose, low-volume prescription that meets total energy on paper but blows past 5 mg/kg/min GIR in a small patient. The second is a high-lipid, low-AA prescription that hits total calories but lands at a non-protein kcal:N ratio above 250:1 and a per-kg protein below 0.8 g/kg/day. Both are visible in the TPN Macronutrient Calculator output without any extra work, which is the point of computing every per-kg and ratio metric in one pass rather than checking them one at a time against reference cards.
The calculator is a prescription-analysis aid, not a compounding recipe — TPN must still be compounded aseptically in the pharmacy, calcium-phosphate solubility has to be checked against the AA product, and enteral feeding should be re-introduced as soon as the gut is usable. Treat the tool as the read-back step before the bag goes up.
For more field guides on clinical calculators and nutrition-support workflows, browse the rest of the Elysia Tools catalog.
