

Mean Platelet Volume is the cheapest differential you can run on a CBC — and most labs leave it sitting in the platelet channel. A single femtolitre reading, paired with the platelet count, narrows the differential between underproduction, peripheral destruction, reactive thrombocytosis, and a myeloproliferative neoplasm in under a minute. The catch is that MPV is method-dependent and shifts in EDTA over time, so the number is only meaningful when you read it the same way every shift.
This field guide walks through how to use the MPV Analyzer on elysiatools.com to turn a raw fL value into an actionable interpretation, what the four-cell MPV/platelet-count grid actually tells you, and the pre-analytical pitfalls that routinely flip a “low MPV” result into a “normal MPV” one.
What MPV actually measures
Platelets aren’t uniform — they ship from the bone marrow as larger, younger reticulated forms and shrink as they age in circulation. Mean Platelet Volume (MPV), reported in femtolitres (fL) by every modern hematology analyzer, is the average size of that circulating pool. The standard adult reference range sits around 7.5–11.5 fL, but lab- and analyzer-specific ranges vary: impedance analyzers trend higher than optical, and optical higher than immuno-flow cytometry. If you’re comparing values across institutions, anchor on the local reference interval, not the textbook number.
MPV is calculated from the same platelet channel as the platelet count itself, which means it costs nothing extra on a CBC with differential — there is no add-on test, no separate draw, no separate billing. Most labs simply don’t surface it on the result report. Open the analyzer’s raw output and the value is there.
The four-quadrant interpretation grid
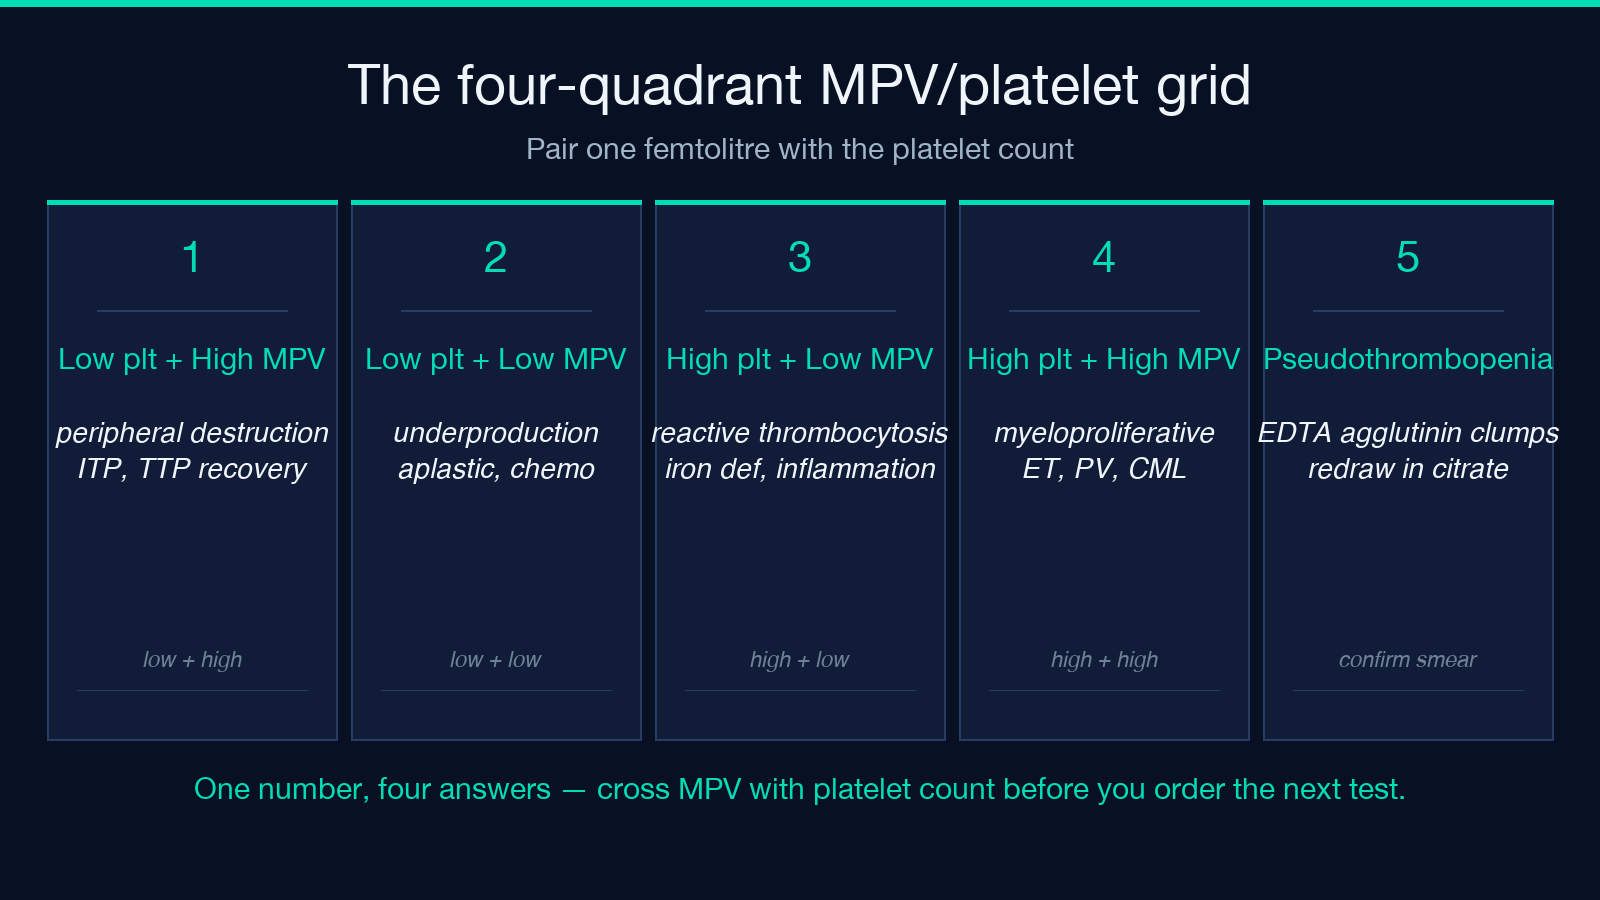
Pair MPV with the platelet count and you get a clean differential. The MPV Analyzer on elysiatools.com encodes exactly this grid:
–
- Low platelets + high MPV → peripheral destruction with marrow compensation. Classic for immune thrombocytopenia (ITP), TTP in recovery, post-DIC rebound, and post-splenectomy states. The marrow is cranking out young, large platelets to replace the ones being consumed in the periphery.
- Low platelets + low MPV → underproduction. Think aplastic anemia, chemotherapy or radiation suppression, recent platelet transfusion, marrow infiltration, or Wiskott-Aldrich syndrome. The marrow can’t keep up, so what does circulate are the older, smaller forms.
- High platelets + low MPV → reactive thrombocytosis. The marrow is responding to a stimulus (iron deficiency, inflammation, infection, malignancy, post-splenectomy) with normal-sized platelets. The size distribution doesn’t shift because the underlying problem is not platelet-specific.
- High platelets + high MPV → myeloproliferative neoplasm territory. Essential thrombocythemia, polycythemia vera, primary myelofibrosis, and chronic myeloid leukemia all cluster here. The platelets are both numerous and large because a clonal population is driving production.
That last cell is the one that justifies the test. A reactive thrombocytosis and an early ET can look identical on a smear — MPV is one of the cheapest ways to start telling them apart.
Worked example: a 12.5 fL result with platelets at 45
Plug MPV = 12.5 fL and Platelet Count = 45 ×10⁹/L into the MPV Analyzer. The output reads:
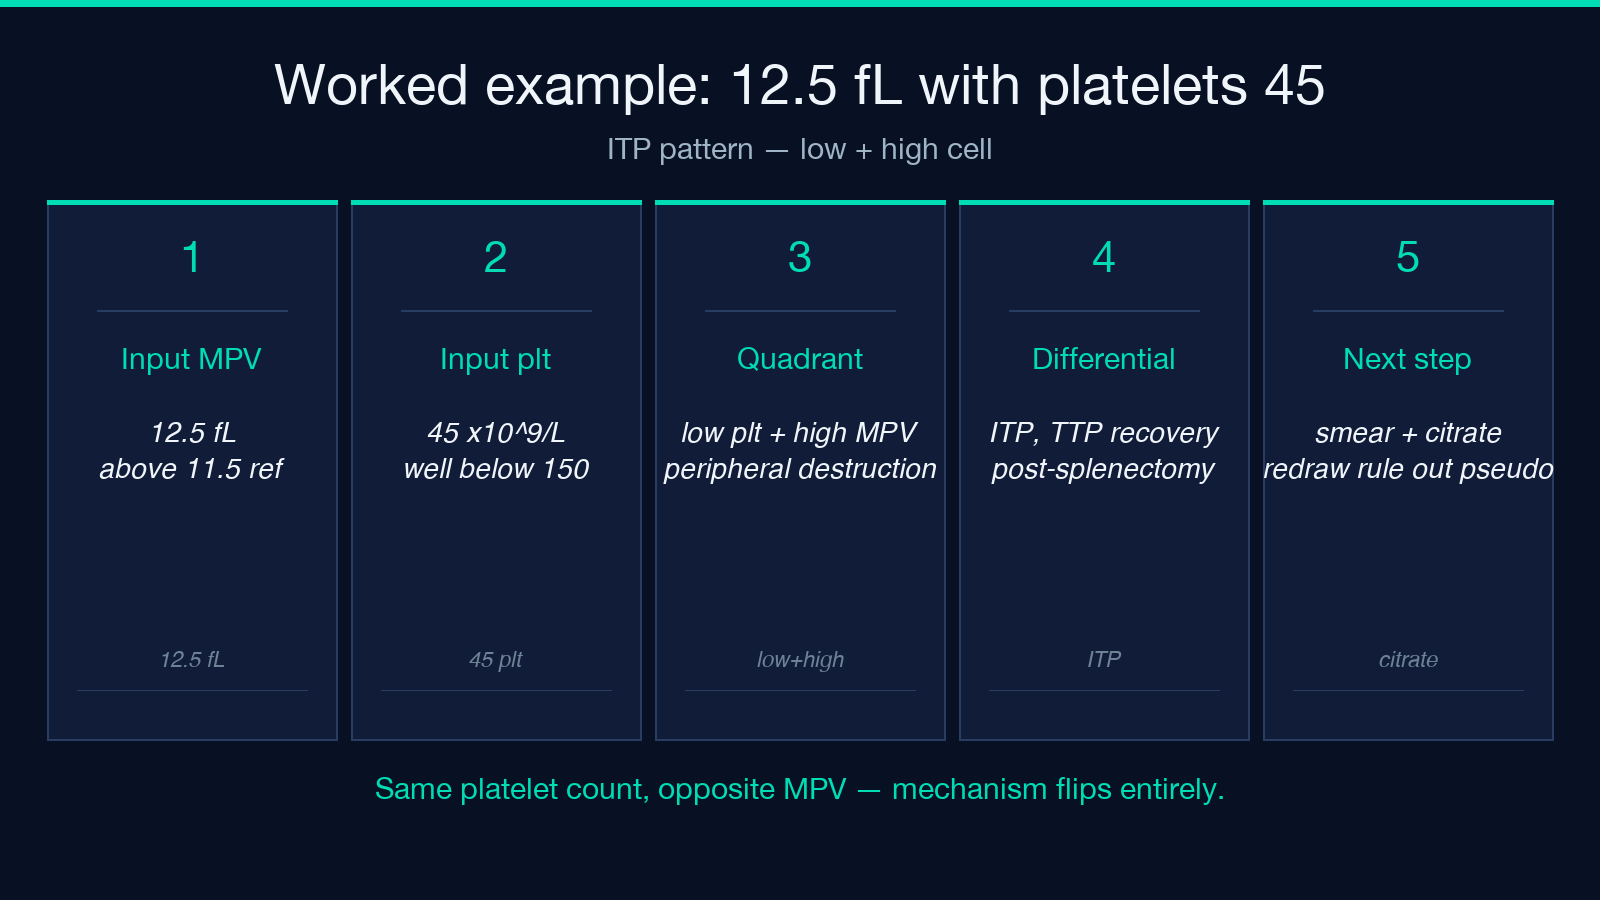
MPV = 12.5 fL (High MPV — large platelets, peripheral destruction or macrothrombocytopenia).This is the low platelets + high MPV cell. In a previously healthy adult with sudden bruising and petechiae, that pattern points squarely at immune thrombocytopenia. The marrow is responding appropriately — the question becomes what’s consuming the platelets.
Compare against a second run: MPV = 7.0 fL, Platelet Count = 25 ×10⁹/L. Same low platelet count, but the MPV is below the 7.5 fL lower reference. That moves you into the low + low quadrant — underproduction. In a patient two weeks post-chemotherapy, that’s the expected pattern. Same platelet number, completely different mechanism, completely different workup.
Pre-analytical pitfalls that flip the answer
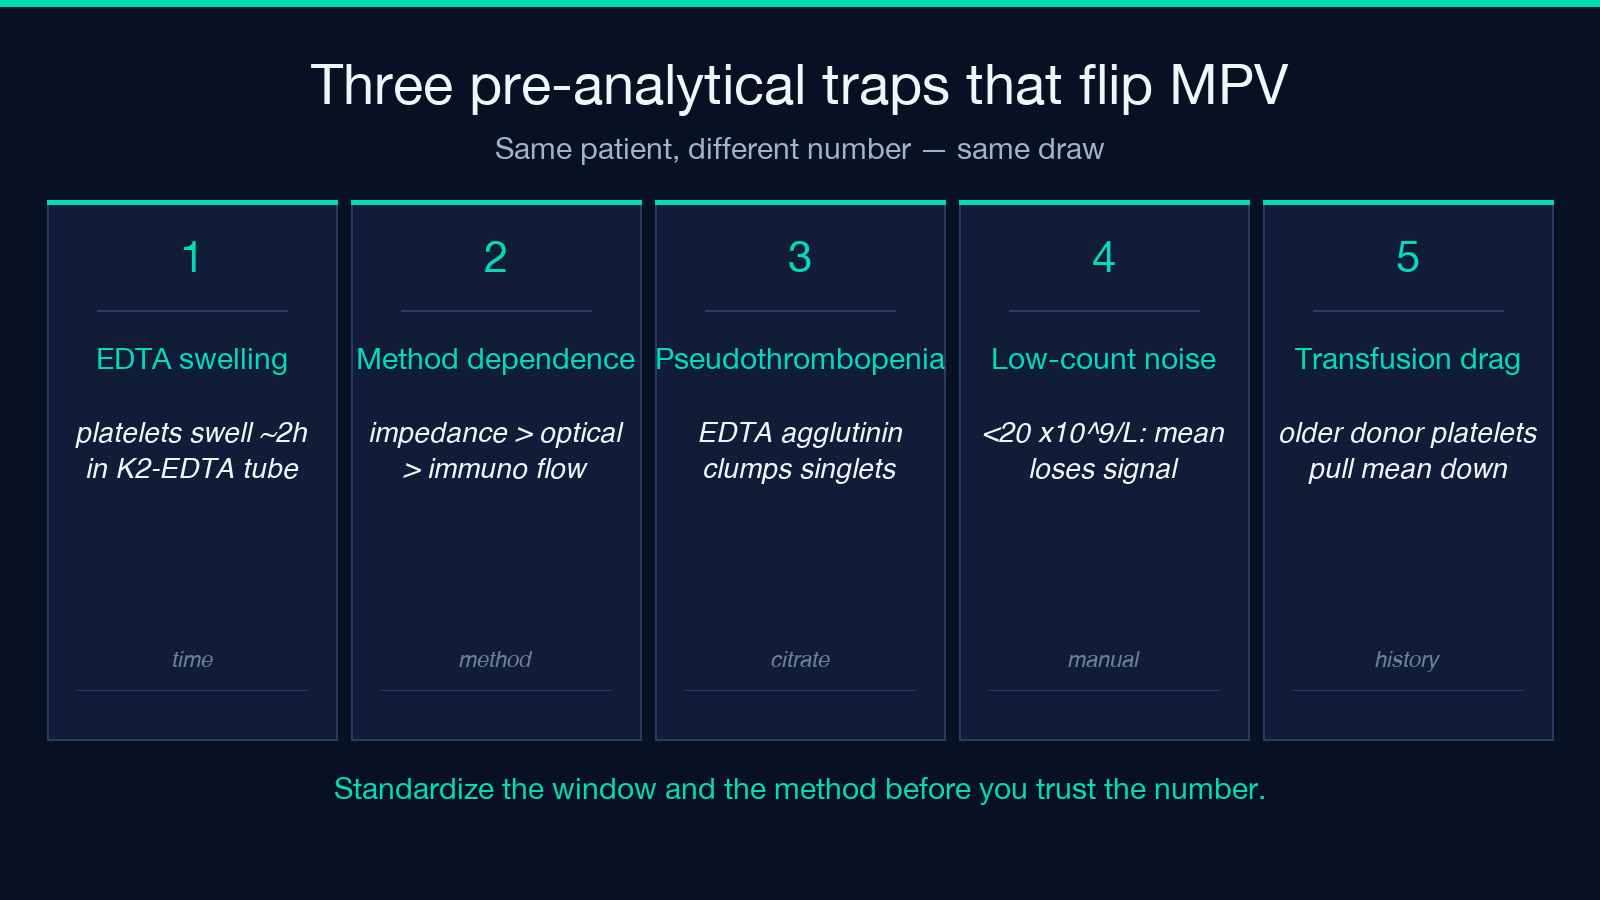
Three pre-analytical factors routinely move MPV by 5–15% between draw and analysis, and they’re the difference between a “normal” and “abnormal” call:
1.
- EDTA time-dependent swelling. Platelets swell in K2-EDTA tubes over roughly two hours, raising the measured MPV. A sample analyzed at 30 minutes versus 3 hours can move from 8.0 to 9.2 fL on the same patient. The College of American Pathologists and ICSH guidelines standardize the MPV measurement window; if your lab doesn’t, ask which window they use.
- Method dependence. Impedance counting (Coulter principle), optical light scatter (Sysmex XN), and immuno-flow cytometry (CD61 gating) don’t return the same number on the same sample. Impedance reads high, optical sits in the middle, immuno reads low. Don’t compare values across methodologies.
- Pseudothrombocytopenia. EDTA-dependent agglutinins clump platelets, dropping the count and inflating the MPV of the remaining singlets. The smear will show clumps. Re-draw in citrate or CTAD to confirm.
For pediatric and neonatal samples, reference ranges also shift — neonates run higher MPV values for the first two weeks of life. Don’t apply an adult reference interval to a cord-blood sample.
Where MPV breaks down
MPV is a population average. It loses signal when:
–
- Platelet count is very low (< 20 ×10⁹/L) — the analyzer’s impedance/optical channel can’t reliably estimate a mean on a few thousand events. The MPV reading becomes noisy. Manual phase-contrast microscopy or immuno-flow is preferred at these levels.
- Heavy macrothrombocytopenia is present (Bernard-Soulier, MYH9) — most platelets are giant, the distribution is bimodal, and the mean loses diagnostic value. The smear tells the story.
- The patient has received a recent platelet transfusion — the transfused platelets are older and smaller than native marrow output, dragging the mean down regardless of what the marrow is doing.
In each of these cases, the analyzer’s MPV is technically reportable but clinically misleading. Treat it as a flag, not a finding.
MPV outside of hematology: the cardiovascular literature
The hematology use case above is the cleanest. There’s a parallel cardiovascular literature, derived from large cohort studies, showing that elevated MPV is an independent marker of platelet activation and predicts adverse outcomes after acute myocardial infarction. The mechanism is the same — younger, larger platelets are more reactive — but the clinical utility is different: in the cardiology setting, MPV is a risk stratifier, not a diagnostic. References from Bath (1996), Leader (2012), and Vagdatli (2010) anchor the methodology; outcome studies (Pizzulli, Mathur, Chu) populate the cardiovascular signal. The MDCalc reference table provides the bedside cutoffs.
For most clinicians, the practical takeaway is: if your CBC analyzer already reports MPV, look at it before you order the next thrombopoietin level.
Putting it into a workflow
The minimum useful routine:
1. Pull MPV from the CBC with differential. If your lab doesn’t surface it, ask — most analyzers already compute it. 2. Cross it with the platelet count to land in one of the four quadrants. 3. For the high + high cell, check the smear and consider JAK2/CALR/MPL testing. 4. For low + high without an obvious consumptive cause, confirm pseudothrombocytopenia with a citrate re-draw before chasing ITP. 5. For low + low in a post-chemotherapy or post-radiation patient, the diagnosis is the history — no further workup needed.
The MPV Analyzer tool handles step 2 — the four-quadrant classification — in a single calculation, returning the interpretation along with the methodology citation. Feed it the analyzer-reported MPV, optionally include the platelet count, and the differential lands in JSON.
If you want to see the tool handle a broader pattern, try it on a ferritin-deficiency case (low MPV, normal-to-high platelets — reactive), or a post-splenectomy patient (high MPV across the board, platelets normal-to-high). The interpretation text changes to match the grid cell.
Reference notes
–
- Bath PMW. The megakaryocyte platelet system. In: Haemostasis and Thrombosis. 1996. Foundational reference for MPV methodology.
- Leader A, Pereg D, Lishner M. The platelet count, mean platelet volume and its relation to coronary artery disease. Acta Haematol. 2012. Cardiovascular risk-stratification cohort.
- Vagdatli E, Gounari E, Lazaridou E, et al. Platelet distribution width: a simple, practical and specific marker of activation of coagulation. Hippokratia. 2010. PDW companion to MPV.
- MDCalc platelet reference tables. Bedside cutoffs and pediatric ranges.
MPV is not a diagnostic in isolation — but it’s a near-free piece of differential data hiding in a CBC you already ordered. The MPV Analyzer gives you the four-quadrant interpretation in one call; the rest is pattern recognition on the smear and the history.
Explore more tools at elysiatools.com.
