
Three numbers and a constant. That is the entire Friedewald formula for LDL-C. Yet for fifty-plus years the same five-by-five division has quietly underestimated LDL-C in patients with hypertriglyceridemia, misled clinicians about familial hypercholesterolemia at low LDL-C, and lived on as the default that every modern lipid panel still reports first. The LDL-C Calculator (Friedewald) at Elysia Tools turns that constant into a one-line result, but the real value is knowing when to trust it — and when the indirect math has quietly drifted 30 percent below the true number.
Why a 1972 Subtraction Formula Is Still the Default
Friedewald published LDL-C = TC − HDL-C − TG/5 in 1972 as a workaround for the era’s expensive direct LDL assays. The key assumption is a constant TG:VLDL-C ratio of 5:1 in mg/dL (or 2.2:1 in mmol/L), which holds well for most fasting adults but collapses the moment VLDL composition changes. Half a century later, the formula is still the first line every clinical chemistry analyzer prints — because it is cheap, fast, and right to within 10 percent for about 80 percent of fasting outpatients. The cost of being “right to within 10 percent” is the other 20 percent: patients with elevated triglycerides, certain dyslipidemias, and the very-low-LDL range get silently misclassified. The LDL-C Calculator (Friedewald) makes the math transparent; the skill is reading the caveats.
The Three-Input, Two-Unit Pipeline
The calculator takes exactly three numeric inputs and one unit-system switch:
- – Total cholesterol (
totalCholesterol) — the panel’s TC value. - – HDL-C (
hdl) — the directly-measured HDL, not calculated. - – Triglycerides (
triglycerides) — TG, which drives the VLDL estimate. - – Unit system (
unitSystem) —mgdl(mg/dL, divide TG by 5) ormmol(mmol/L, divide TG by 2.2). - – Decimal places (
decimalPlaces) — output rounding, default 1 in mg/dL and 2 in mmol/L. - Triglycerides ≥ 400 mg/dL (4.5 mmol/L). The constant no longer holds; VLDL particles become cholesterol-enriched, and the calculator will progressively underestimate LDL-C as TG rises. In practice: a TG of 500 with the same TC and HDL returns a value that is 15–25 percent below a direct assay.
- Non-fasting state. TG rises 20–30 percent after a normal meal. For most clinical decisions the bias is acceptable, but for borderline cases it tips the result into a different band.
- Type III dysbetalipoproteinemia (broad-beta disease). VLDL composition is abnormal; apoE2/E2 genotype. Friedewald dramatically underestimates — sometimes returning negative values.
- Very low LDL-C (< 70 mg/dL / 1.8 mmol/L). The absolute error stays small but the relative error grows. For high-risk secondary prevention where every mg/dL matters, switch to a direct assay or the Martin/Hopkins equation.
- Patients on certain PCSK9 inhibitors or with chylomicronemia. Lipid composition is pharmacologically or pathologically altered.
- Panel A — typical fasting adult (mg/dL): TC 220, HDL 45, TG 150. Calculator:
220 − 45 − 150/5 = 145. Borderline high. Consider moderate-intensity statin after 10-year ASCVD risk. - Panel B — high-triglyceride case (mg/dL): TC 260, HDL 38, TG 480. Calculator:
260 − 38 − 480/5 = 126. Result:"near-optimal". But TG ≥ 400 invalidates the assumption — the direct assay will likely return 145–165, shifting the band from near-optimal to borderline-high. This is the silent-misclassification failure mode. - Panel C — SI units (mmol/L): TC 5.7, HDL 1.2, TG 1.7. Calculator:
5.7 − 1.2 − 1.7/2.2 ≈ 3.73. Borderline. The constant changes from 5 to 2.2 because mg/dL and mmol/L cholesterol differ by 38.7, but the TG:cholesterol ratio inside VLDL particles stays constant in molar terms. - – Martin/Hopkins (2013) — uses a variable TG:VLDL-C ratio stratified by TG and non-HDL-C, improving accuracy at low LDL-C and at TG 200–399. Now the default in many US labs.
- – Sampson-NIH (2020) — extends the Martin approach with 180 cells of stratified ratios, validated for non-fasting samples and very low LDL-C (< 70 mg/dL).
- – Cholesterol: 1 mmol/L = 38.67 mg/dL (so 3.73 mmol/L × 38.67 ≈ 144.2 mg/dL, matching the Panel A case).
- – Triglycerides: 1 mmol/L = 88.57 mg/dL (so 1.7 mmol/L TG ≈ 150.6 mg/dL).
The output object returns the computed ldlC in the input unit, the unit string, and a clinical band label such as "borderline high" (130–159 mg/dL) or "high" (160–189 mg/dL). For TC = 220, HDL = 45, TG = 150 in mg/dL the calculator returns LDL-C = 145 mg/dL — the classic borderline-high case. The same inputs in mmol/L (TC 5.7, HDL 1.2, TG 1.7) return LDL-C ≈ 3.73 mmol/L, which sits in the borderline 3.4–4.1 mmol/L band.
Five Edge Cases Where the Formula Quietly Fails
The 5:1 assumption is the whole story, and where it breaks:
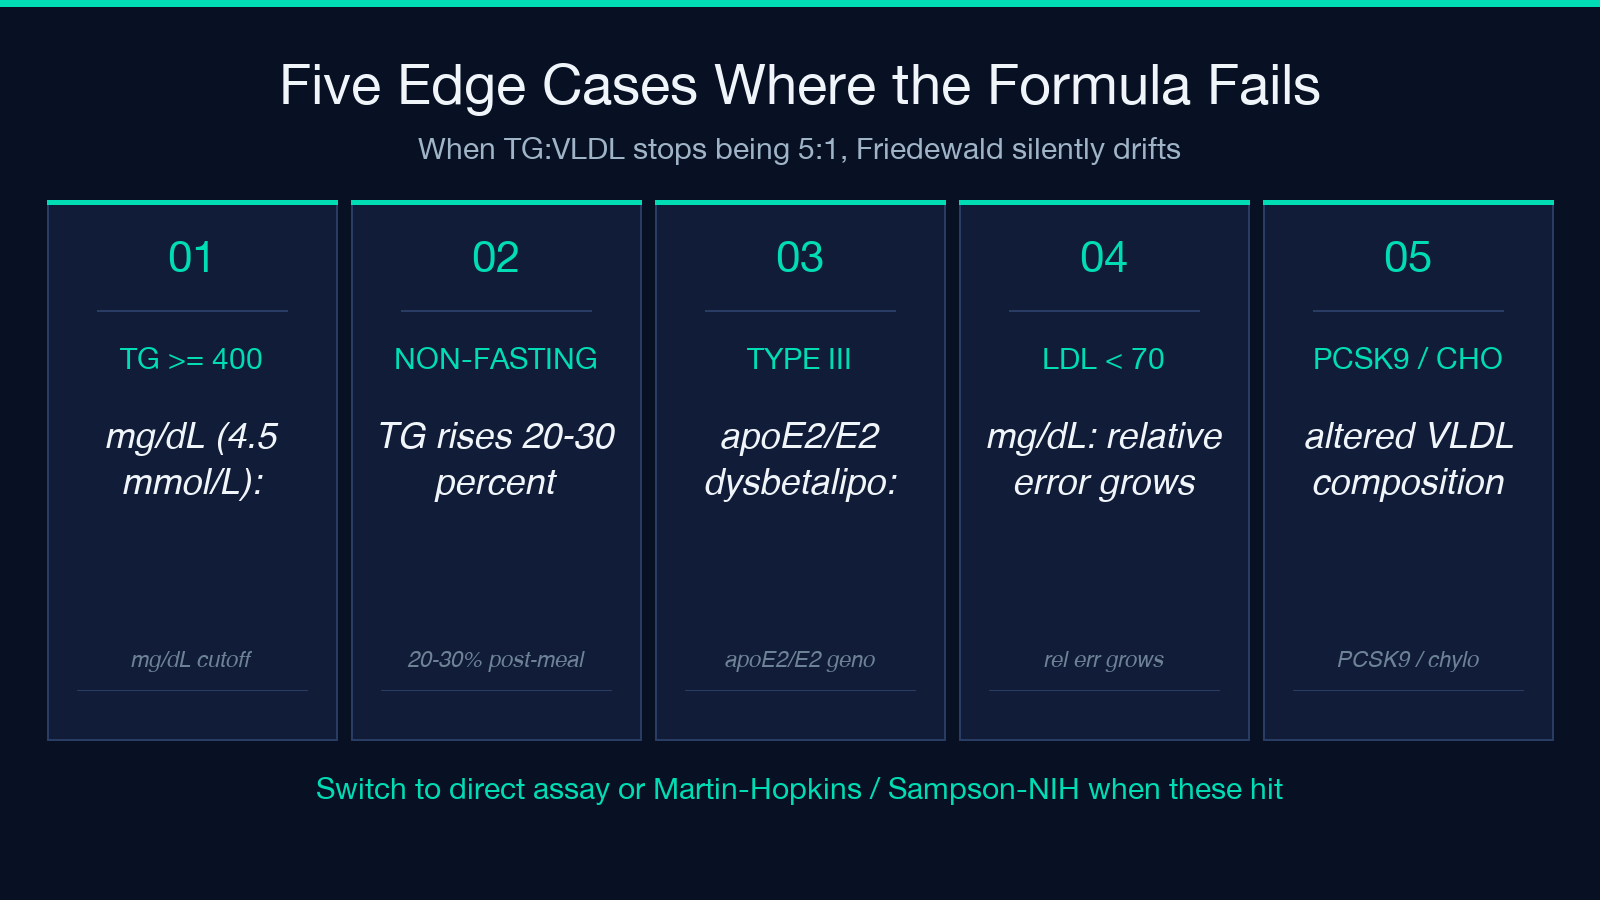
In all five cases the calculator’s result is mathematically correct given its assumptions — it just stops being a faithful estimate of the patient’s actual LDL particle count. Watch for the message: "LDL-C = X mg/dL (note: TG ≥ 400, consider direct assay)".
Reading the Result Through ACC/AHA 2018 Thresholds
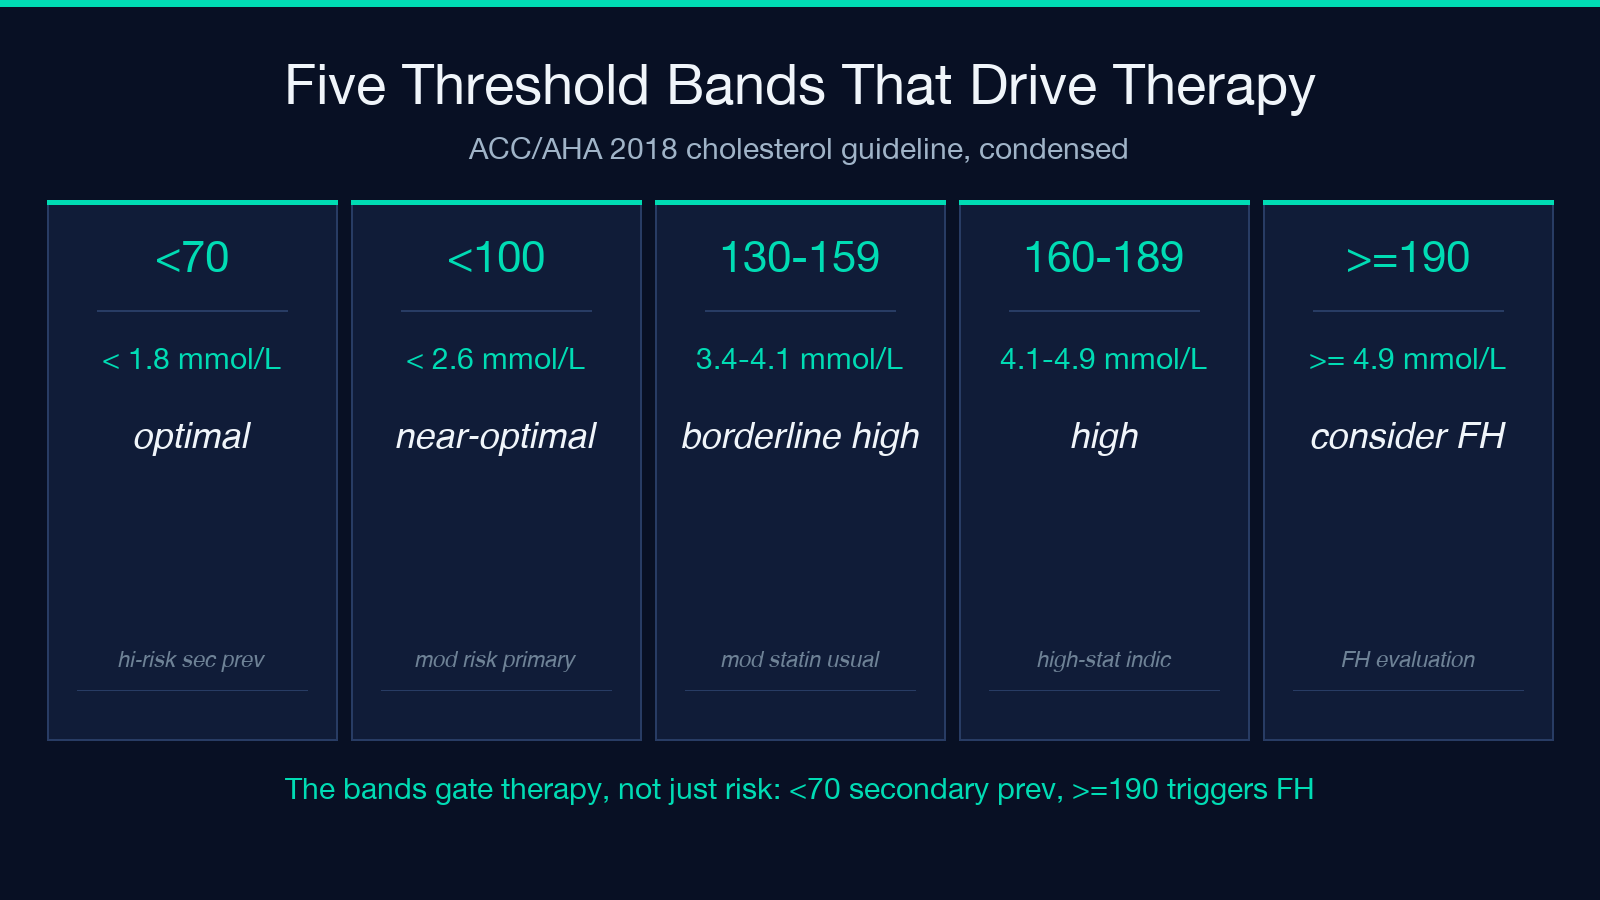
The calculator tags each result with an ACC/AHA 2018 band:
| mg/dL | mmol/L | Band | Clinical context |
|---|---|---|---|
| ——– | —— | —————— | < 70 |
| < 1.8 | Optimal | High-risk secondary prevention target | < 100 |
| < 2.6 | Near-optimal | Moderate risk / diabetes primary prevention | 100–129 |
| 2.6–3.3 | Borderline | Lifestyle intervention first | 130–159 |
| 3.4–4.1 | Borderline high | Moderate-intensity statin usually indicated | 160–189 |
| 4.1–4.9 | High | High-intensity statin indicated | ≥ 190 |
The bands exist to drive therapy, not just describe risk. A patient at 145 mg/dL is not just “borderline high”; they are at the threshold where the 2018 cholesterol guideline typically calls for moderate-intensity statin therapy after ASCVD risk assessment. A patient at 191 mg/dL is not just “high” — they need FH evaluation, and the calculator’s output band is the trigger.
Walking Three Real Panels
Three worked examples make the caveats concrete:
Friedewald vs. Martin-Hopkins vs. Sampson-NIH: When to Switch
Two modern equations address Friedewald’s weaknesses:
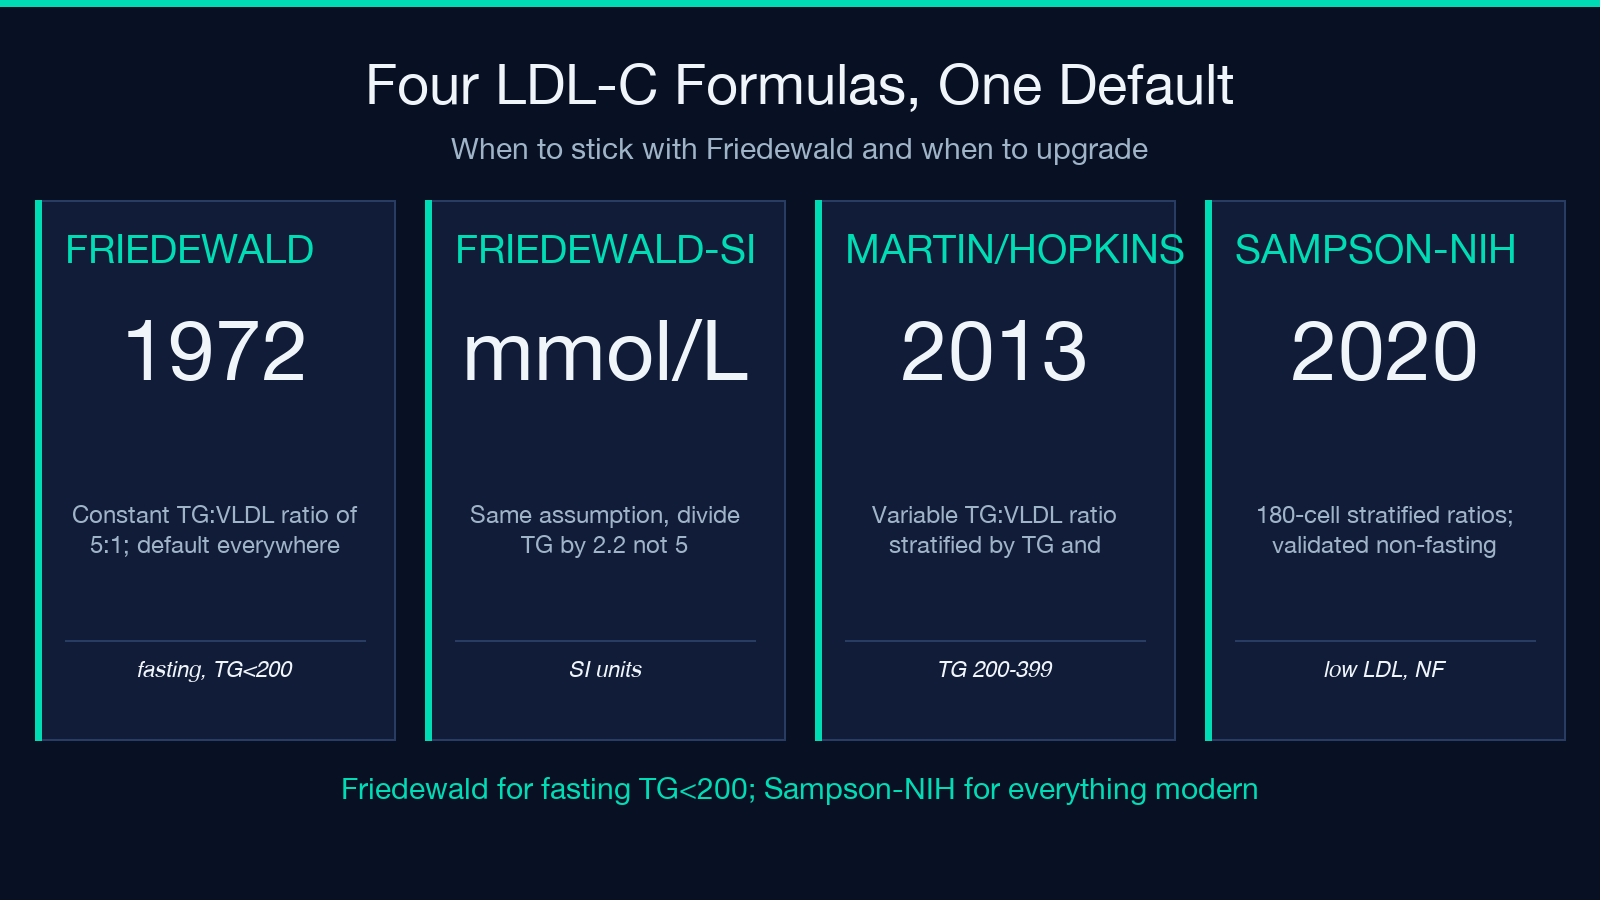
The Friedewald calculator remains useful for fasting panels with TG < 200, where its accuracy matches the modern equations within 1–2 percent. It is the right tool for pediatric panels, routine physicals, and statin-naive outpatients. For everything else — TG 200–399, non-fasting draws, very low LDL-C, or PCSK9-treated patients — request a Martin/Hopkins or Sampson calculation directly from the lab, or run the same inputs through a Sampson calculator if your lab doesn’t offer it natively. The Friedewald calculator is the right default, not the right always.
The mg/dL vs. mmol/L Trap
The single biggest unit-conversion bug:
The Friedewald formula uses 5 in mg/dL and 2.2 in mmol/L — those are not arbitrary; 5 / 2.2 ≈ 2.27, which matches the molar ratio TG:cholesterol in VLDL particles (TG MW 885, cholesterol MW 387, ratio ~2.29). The constants are the same assumption, just in different unit systems. Mixing units — TC in mg/dL, TG in mmol/L — is the most common input error and silently produces wrong results. Always set unitSystem to match all three of TC, HDL, and TG. The calculator will not detect a unit mismatch; the result will simply be wrong.
When This Tool Ends and a Direct Assay Begins
The Friedewald formula is a calculation. It cannot diagnose familial hypercholesterolemia, it cannot measure LDL particle number, it cannot replace a beta-quantification ultracentrifugation, and it cannot tell apoB from apoA1. Use it as the first-pass estimate and the gate to therapy, then escalate when:
– TG ≥ 400 mg/dL → direct LDL assay or Martin/Hopkins. – LDL-C < 70 mg/dL on statin therapy → Martin/Hopkins or Sampson-NIH for tighter tracking. – Non-fasting draw with TG 200–399 → Sampson-NIH. – Suspected FH (LDL-C ≥ 190 mg/dL or family history) → Dutch Lipid Clinic Network score, genetic testing, direct assay. – Pediatric or pregnancy panels → direct assay.
Three inputs, one constant, one result. The Friedewald formula at Elysia Tools is the right calculator for the right patient, and the right warning label when the patient is no longer that patient. Use it to start the conversation; let the lab finish it.
Explore more clinical calculators at Elysia Tools.
