# The Same Equation Governs a Swinging Pendulum and a Population Boom. Here’s Why That Matters.
In 1963, a meteorologist named Edward Lorenz was running weather simulations on a computer at MIT. To save time, he restarted a run from a mid-computation printout — the printout showed three digits after the decimal point, but the computer had stored six. The difference was less than one part in a million.
The resulting weather pattern diverged wildly from the original. Lorenz had stumbled into chaos.
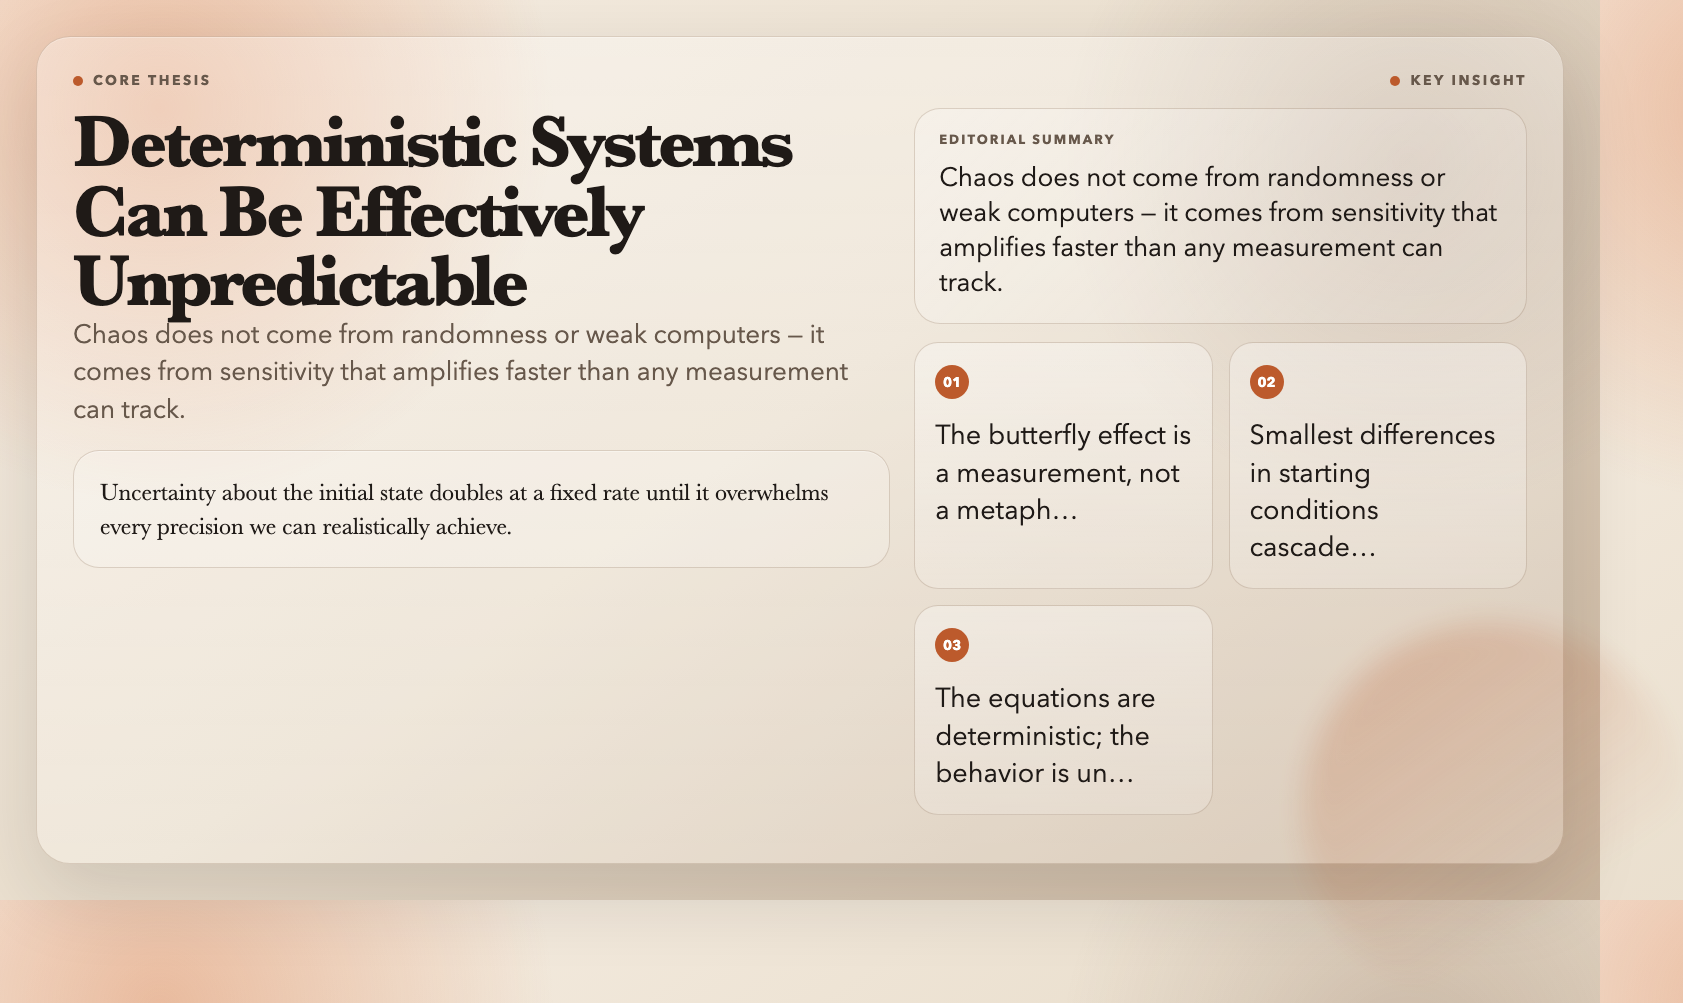
The counterintuitive finding at the heart of chaos theory: some deterministic systems are effectively unpredictable. Not because they are random. Not because computers are weak. Because uncertainty about the initial state doubles at a fixed rate until it overwhelms every precision we can realistically achieve. Lorenz’s tiny rounding error cascaded into an entirely different weather system within minutes.
This discovery is not a meteorological curiosity. The same mathematical structure that produces chaos in weather governs a swinging pendulum, population booms, electronic circuits, and the human heartbeat. Understanding chaos changes what you think prediction can and cannot do.
The Double Pendulum: Where Order Breaks Down
A single pendulum swings with metronomic regularity. Set it from the same angle, and it traces the same arc. The equations are textbook material — write the solution on an index card, predict the position at any future second.
Now attach a second pendulum to the end of the first. Let both swing freely through large angles.
The equations are still Lagrange’s 18th-century formulas. Two masses, two rods, gravity, trigonometry. Nothing a laptop cannot solve.
Watch what actually happens. The second pendulum whips around unpredictably. The apparatus traces irregular loops through the air. Start it twice from what appears to be the same position — same initial angles, same angular velocities — and within seconds the two runs look unrelated. They are not unrelated. They are deterministic. But they have diverged past the point of practical prediction.
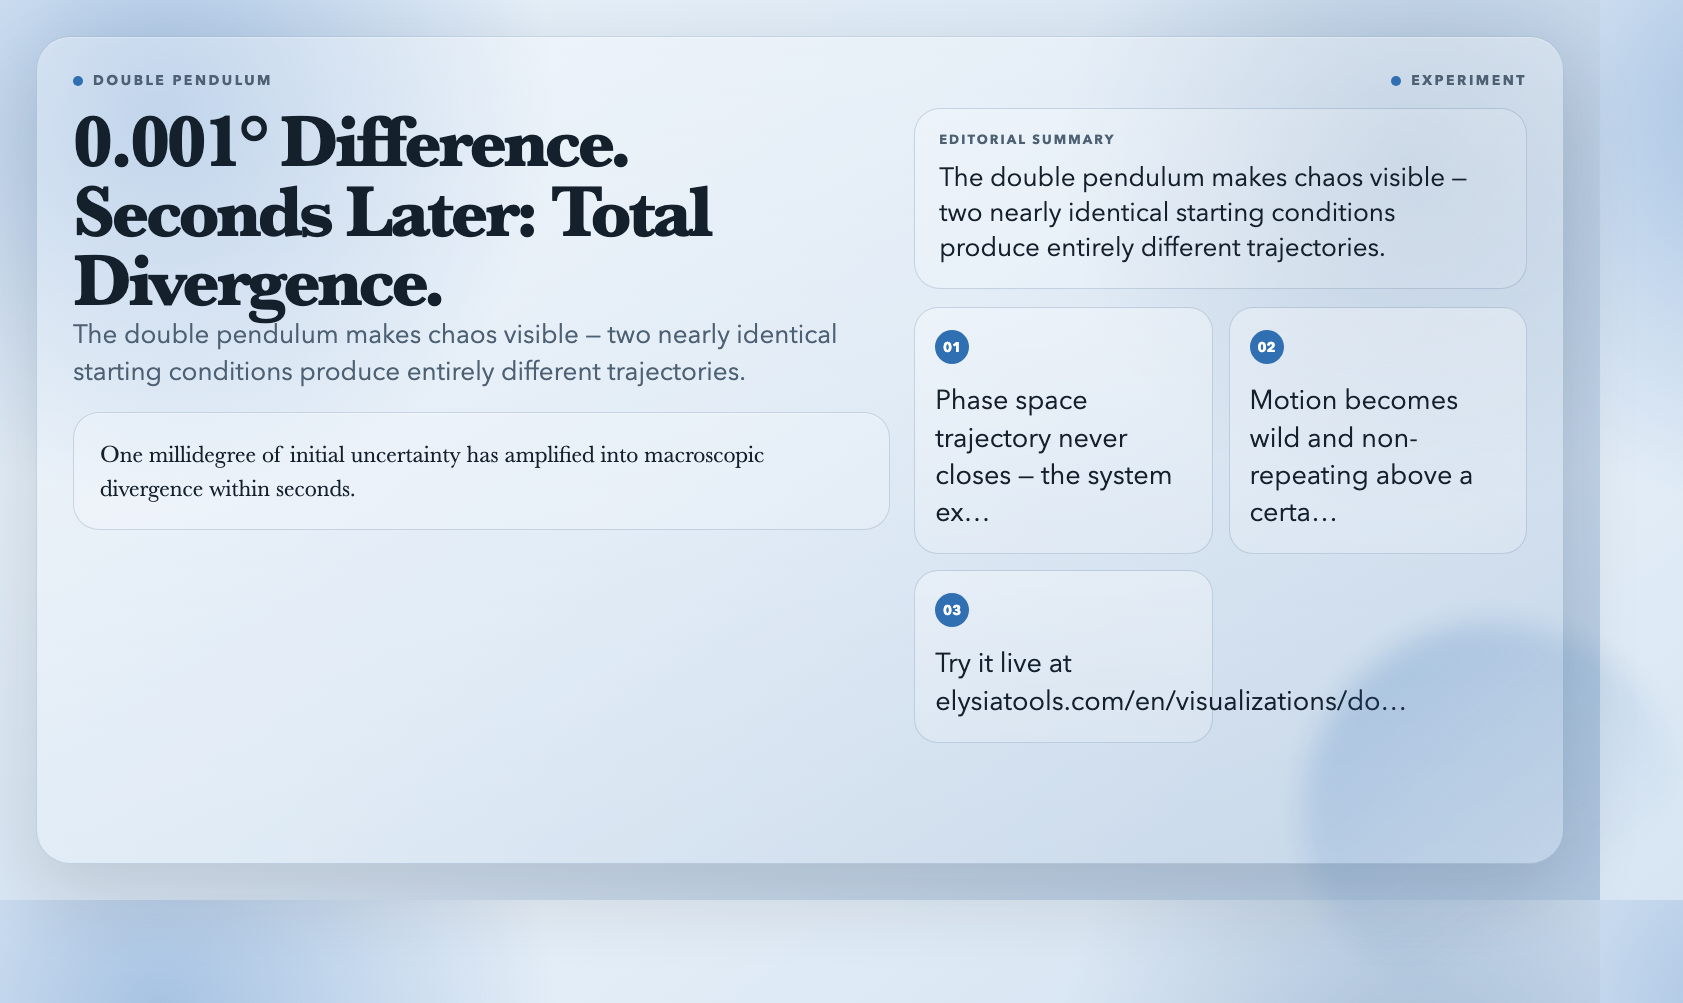
The Double Pendulum Chaos tool on ElysiaTools lets you run this experiment in your browser. Set the initial angles. Enable multi-trail mode. Launch two pendulums with starting angles that differ by 0.001 degrees — a difference no instrument can detect by eye. Watch them diverge. One millidegree of initial uncertainty has amplified into macroscopic divergence within seconds.
This is the butterfly effect as measurement, not metaphor. Edward Lorenz used it to mean something precise: in a chaotic system, uncertainty doubles at a fixed rate until it fills the entire accessible phase space.
The phase space plot on the visualization makes this visible. Each point represents a specific combination of angle and angular velocity. For a simple pendulum, the trajectory forms a closed loop — the system returns to the same state periodically. For the double pendulum, the trajectory never closes. It traces intricate paths that fill space without repeating. The system explores forever.
The Logistic Map: Chaos from a One-Line Equation
Now look at something that seems entirely different: a model of how animal populations change from year to year.
Biologists use the logistic map:
x_{n+1} = r · x_n · (1 – x_n)
x_n is the population as a fraction of maximum carrying capacity. r is the growth rate. Plug in this year’s population, multiply by growth rate and remaining room, get next year’s population. One line. No random numbers.
At small r, the population converges to a stable number and stays there. As r increases, the equilibrium loses stability. The population oscillates between two values. Then four. Then eight. The path from order to chaos goes through period doublings — a bifurcation at each step.
At r ≈ 3.56995, the period becomes infinite. The system enters chaos.
At this value, long-term behavior is unpredictable — even though the equation contains no randomness. Set r = 4 with x_0 = 0.1 and run it forward. The sequence looks like white noise. It is not noise. It is deterministic. But you cannot predict it beyond a few iterations without running the equation itself.
Robert May, an ecologist at Princeton, popularized this model in a 1976 paper with the straightforward title “Simple Mathematical Models with Very Complicated Dynamics.” He was one of the first scientists to recognize that the same period-doubling route to chaos appeared in actual population data — not just in the algebra.
The Bifurcation Diagram on ElysiaTools shows the entire progression at once. Each vertical slice displays all values the system stabilizes on at a given r. The branching structure — one line splitting into two, four, eight — looks like a tree growing toward chaos.
Zoom into any branching region. The pattern repeats. A magnified period-4 region resembles a scaled version of the period-2 region. Zoom again, and it mirrors the period-1 region. The structure is self-similar at every scale. Fractal geometry embedded in a single line of algebra.

The Feigenbaum Constant: The Same Number Everywhere
Mitchell Feigenbaum was a physicist at Los Alamos in the early 1970s. He noticed that successive bifurcation intervals in the logistic map shrink by the same ratio, regardless of the system. He measured it:
δ ≈ 4.669201…
He tested it on a dripping faucet. Same number. He tested it on electronic circuits. Same number. Chemical reactions. Same number. He had found what appears to be a universal law of nature: any system that undergoes period-doubling on the route to chaos converges to this ratio at the transition points.
The same constant describes the route to chaos in fluid turbulence, cardiac arrhythmias, and economic cycles. A number from a population model governs the onset of chaos in a dripping faucet.
The Feigenbaum Constant visualization on ElysiaTools marks these bifurcation points on the logistic map, showing the constant appear in the spacing between successive branching events.
The Practical Gap Nobody Has Solved
Here is the part chaos theory has not delivered: control.
You can identify a chaotic system after the fact. You can measure the Lyapunov exponent after chaos appears. You can map bifurcation diagrams after the fact. But you cannot look at a new system and predict its chaos transition with the same confidence you can predict a solar eclipse.
This gap has consequences. Weather prediction is chaotic — a five-day forecast is less reliable than a one-day forecast, and forecasters quantify this decay explicitly. Cardiac fibrillation represents chaotic dynamics in the heart’s electrical system. Epileptic seizures sometimes emerge from chaotic transitions in neural activity. Power grids can exhibit chaotic behavior under certain load conditions, leading to cascading failures that look sudden in hindsight but are mathematically predictable only after the fact.
The double pendulum and the logistic map do not solve these problems. But they make chaos tangible — and tangible things can be studied, questioned, and eventually understood in ways that equations alone cannot achieve.
That matters more than it sounds like it should.
All visualizations mentioned are freely available at ElysiaTools, a browser-based tool library requiring no download or account.