Why Your Phone Charger Gets Hot: The Hidden Math Behind Every Wall Outlet
Plug in your phone charger and something strange happens. The little box on the cable warms up. Not from the DC battery it feeds — from the AC power it converts. That warmth is a window into one of the most elegant formulas in electrical engineering.
Alternating current — AC — is the form of electricity that flows into every home on Earth. Unlike the steady push of a battery, AC electrons reverse direction roughly 50 or 60 times per second, creating a wave pattern called a sine wave. This wave is not arbitrary. It is the natural consequence of spinning a magnet near a coil of wire, and it has a mathematical structure that engineers have exploited for over a century.
The Wave Your Wall Outlet Sends
A sine wave oscillates between two extremes — a positive peak and a negative trough — and back again, 50 or 60 times each second depending on where you live. The number of complete cycles per second is the frequency, measured in Hertz (Hz). China uses 50 Hz; the United States uses 60 Hz. Both work. The frequency choice is mostly historical convention, not physics law.
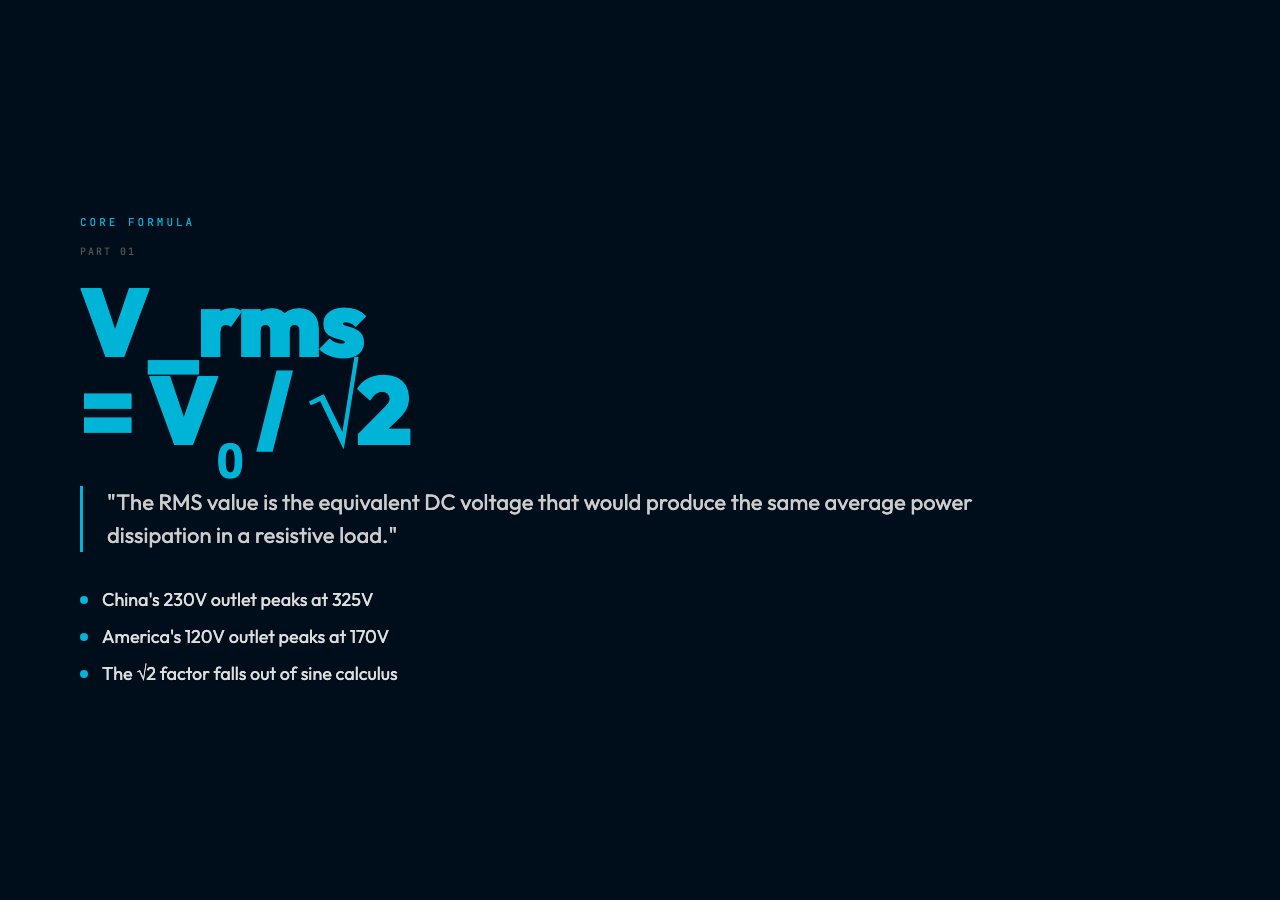
The peak voltage — the maximum instantaneous value the wave reaches — is not what your devices actually use. In China, the wall outlet is labeled 230V, but the sine wave actually peaks at roughly 325V before swinging back down to -325V. This is intentional: a sine wave’s average value over a full cycle is zero, because the positive and negative halves cancel out. Power delivery, however, depends on something different.
RMS: The Voltage That Actually Matters
Your phone charger does not care about peak voltage. It cares about the Root Mean Square (RMS) value — the equivalent DC voltage that would deliver the same power to a resistive load.
The math is straightforward. For a sine wave:
V_rms = V_peak / √2 ≈ V_peak × 0.707
China’s 230V RMS outlet peaks at 325V. America’s 120V RMS outlet peaks at 170V. In both cases, the ratio is 0.707 — a consequence of how the sine function integrates over a full cycle. The √2 in the denominator is not arbitrary; it falls directly out of the calculus of computing the “heating equivalent” of a varying voltage.
This is why household voltage specifications are always RMS values. A 230V outlet is safe to treat as a steady 230V for the purpose of power calculations, even though the actual voltage swings from -325V to +325V sixty times per second.
Why AC Won the Current Wars
In the 1880s, Thomas Edison championed direct current (DC) — electricity that flows in one direction at a steady voltage. Nikola Tesla argued for alternating current, which could travel hundreds of miles at high voltage before stepping down to safer levels for homes.
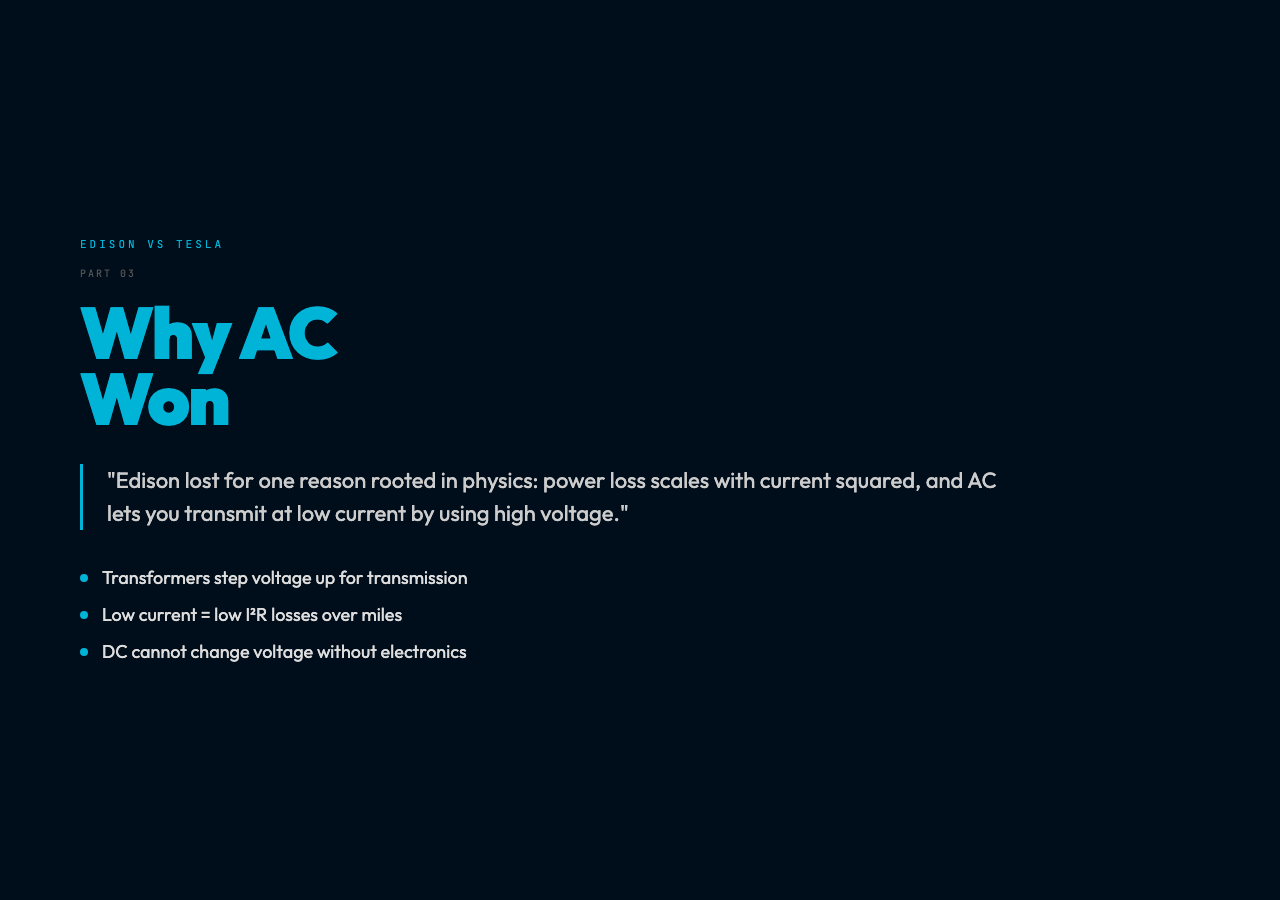
Edison lost for a fundamental reason rooted in RMS. Power loss in a transmission line scales with the square of the current (P = I²R). To transmit the same amount of power at low current (reducing losses), you need high voltage. DC cannot easily change voltage — doing so requires complex electronic circuits. AC changes voltage trivially with a transformer: two coils of different sizes, linked by a magnetic core, stepped up or down with near-perfect efficiency.
A step-up transformer at the power plant raises voltage from a few hundred volts to hundreds of thousands of volts for long-distance transmission. At the city boundary, step-down transformers reduce it to the 230V or 120V RMS that enters buildings. This elegance is why the entire world’s electrical grid converged on AC within a few decades.
The Four Numbers That Describe Any AC Wave
Every AC waveform — whether from a power plant, a guitar amplifier, or a radio antenna — is fully described by four parameters:
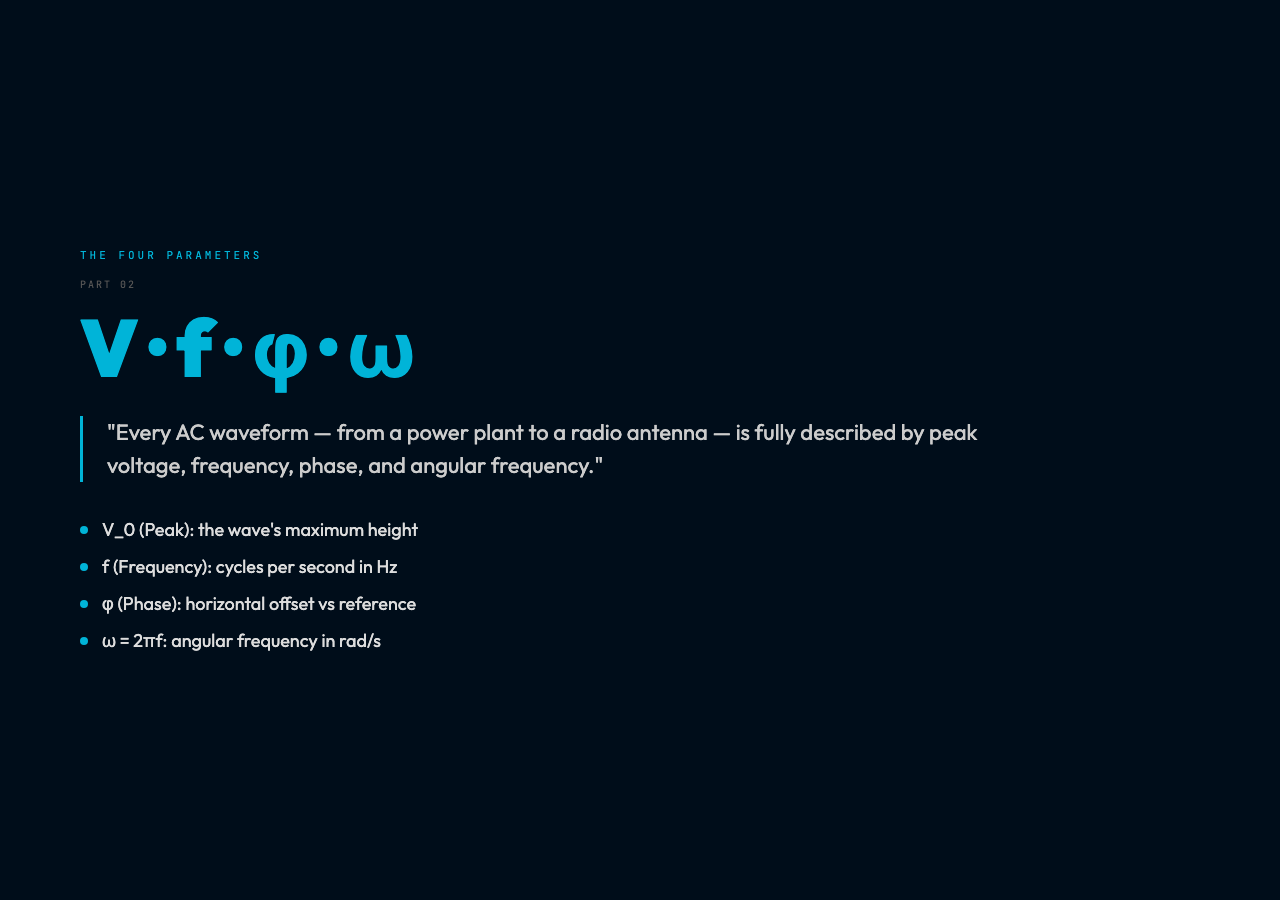
Peak voltage (V_0) — the maximum instantaneous value, the height of the wave’s crest.
Frequency (f) — how many complete cycles occur per second, measured in Hertz.
Phase (φ) — the horizontal offset of the wave relative to a reference. Two waves of the same frequency but different phase “meet” differently when they interfere. Phase difference of 0° means the waves align perfectly; 180° means they cancel completely.
Angular frequency (ω) — the frequency expressed in radians per second. Since one complete cycle is 2π radians, ω = 2πf. Engineers prefer ω because it simplifies the differential equations that describe circuits.
These four numbers are not independent — they are linked by clean formulas: – Period: T = 1/f (seconds per cycle) – Angular frequency: ω = 2πf (radians per second) – RMS voltage: V_rms = V_0/√2
Where AC Shows Up in Unexpected Places
The power grid is the obvious application. But the AC waveform is everywhere once you learn to see it.
Audio signals are AC. A microphone captures sound as a varying voltage that oscillates at audio frequencies (20 Hz to 20 kHz). When that signal reaches a speaker, the same principles of frequency and amplitude apply — only the domain has changed from power engineering to acoustics.
Radio transmission uses AC at extremely high frequencies (kilohertz to gigahertz) to carry information through the air. AM radio modulates the amplitude of an AC carrier wave; FM radio modulates its frequency. The mathematics is identical to what happens in your wall outlet, just at very different speeds.
Electric motors run on AC because the alternating direction of current naturally produces a rotating magnetic field in the motor’s stator — no complicated electronic commutation required. This simplicity is why AC motors are among the most durable machines ever built.
Power factor correction in industrial settings deals with a subtle AC phenomenon: when circuits contain capacitors or inductors, the voltage and current waves can become misaligned in phase. This reduces real power delivery even though apparent power (V_rms × I_rms) looks unchanged. Large factories pay penalties for low power factor and install capacitor banks to bring current back in phase with voltage.
The Simulation: Seeing the Wave
The AC Characteristics visualization lets you manipulate peak voltage, frequency, and phase independently and watch the waveform respond in real time. The oscilloscope display shows both the AC wave and a reference DC level so you can visually compare peak versus RMS.
You will notice something immediate: changing frequency stretches or compresses the wave horizontally without changing its height. Changing peak voltage changes the wave’s height. But changing phase shifts the wave left or right — and if you overlay two waves of different phase, you can see the constructive and destructive interference where they sum.
The global standards panel shows why the world divided into 50 Hz and 60 Hz camps. The answer is partly historical accident (generator speeds and lamp flicker thresholds in the early 1900s) and partly engineering practicality (60 Hz allows slightly smaller transformers for the same power capacity).
Try the simulation: AC Characteristics – Interactive Visualization