Why Dice Probability Doesn’t Behave the Way Your Gut Says
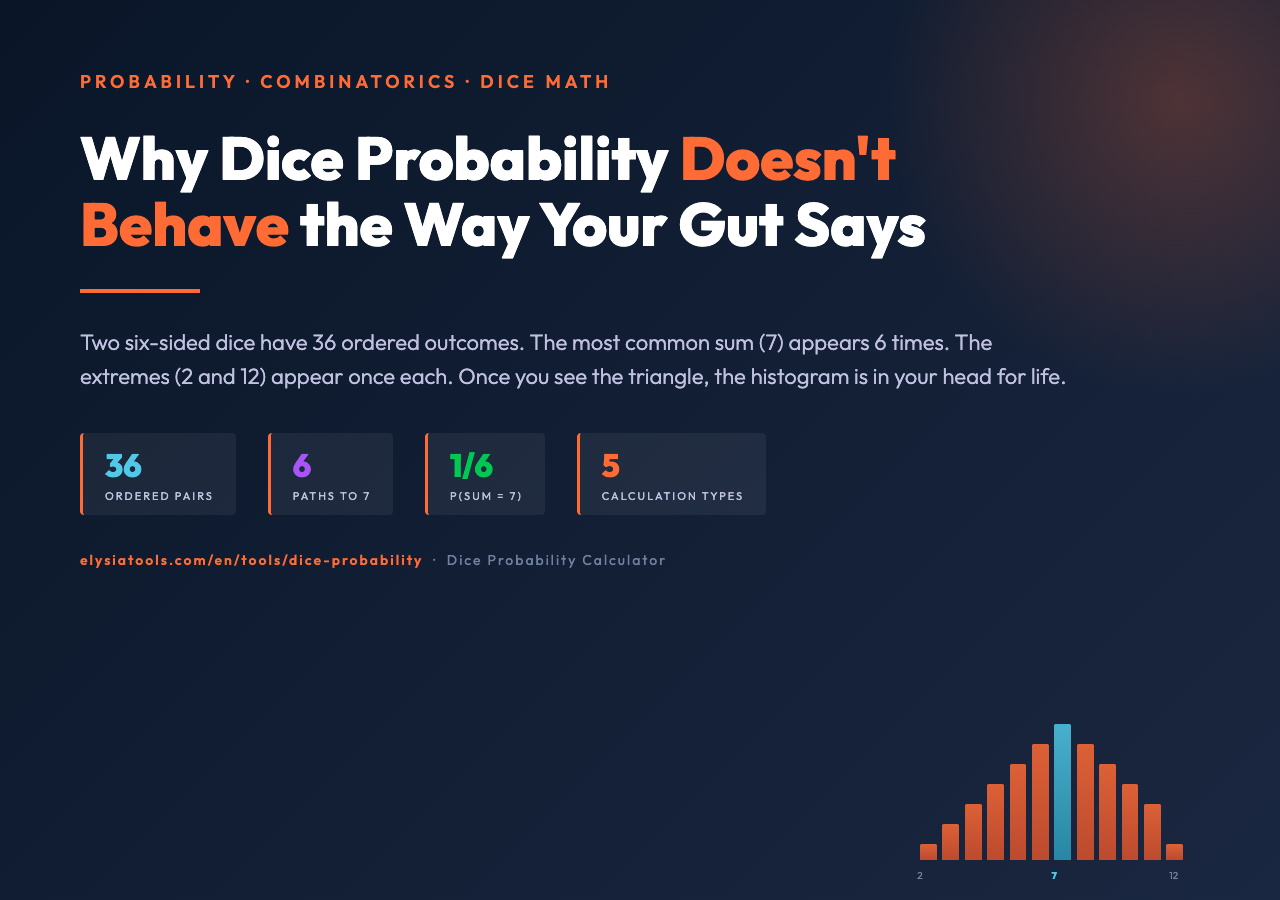
Roll two six-sided dice and ask five friends what sum comes up most often. You’ll usually get two votes for “seven,” one or two for “six or eight,” and at least one “high numbers win.” Most of that intuition is wrong in a measurable, surprising way: when you plot the histogram of every sum from 2 through 12, it isn’t flat, it isn’t bell-curved, it isn’t pyramid-shaped. It is a triangle, peaking at 7 with six paths to land there. Once you internalize that one shape, the rest of dice probability becomes a small set of counting choices you can apply to anything from craps to Yahtzee to Monopoly dice.
You don’t need a Monte Carlo simulation to verify any of this. A single mental model — count the favorable outcomes, divide by the total — gets you 95% of the questions people actually ask about dice. The Dice Probability Calculator handles the remaining 5% where the counts get into the hundreds and where exact sums start showing their asymmetric tails. This piece walks through the three countings you actually need, the four readings the calculator gives you, and the three traps that show up even when the math is correct.
The One Counting Rule Dice Probability Hinges On
Every dice probability problem reduces to a fraction: favorable outcomes divided by total outcomes. For a single die, that’s easy — six faces, six equally likely results, so any specific value shows up with probability 1/6. For two dice, the trap appears, because the two dice are distinguishable (a 3 on die A and a 4 on die B is not the same as a 4 on A and a 3 on B), so the “total outcomes” sample space has 36 elements, not 21.
This single observation is the difference between intuition and reality. People who guess “seven is most likely” are right; people who guess “seven happens twice as often as three” are wrong, because 7 has 6 paths but 2 and 12 each have only 1 path, so seven is six times more frequent than the extremes, not twice. Use the calculator with two six-sided dice and select “Full Distribution” to see the histogram (2 = 1, 3 = 2, 4 = 3, 5 = 4, 6 = 5, 7 = 6, 8 = 5, 9 = 4, 10 = 3, 11 = 2, 12 = 1), and the symmetry becomes unmissable — the triangle peaks at 7 with mirror-image shoulders falling off on either side.
Three Calculations The Calculator Does Better Than Your Scratchpad
Once the 36-cell sample space is in your head, four question types cover almost everything you actually ask. Each one corresponds to a “Calculation Type” option in the tool, and each one is a specific count divided by either 6, 36, 216, or n^sides.
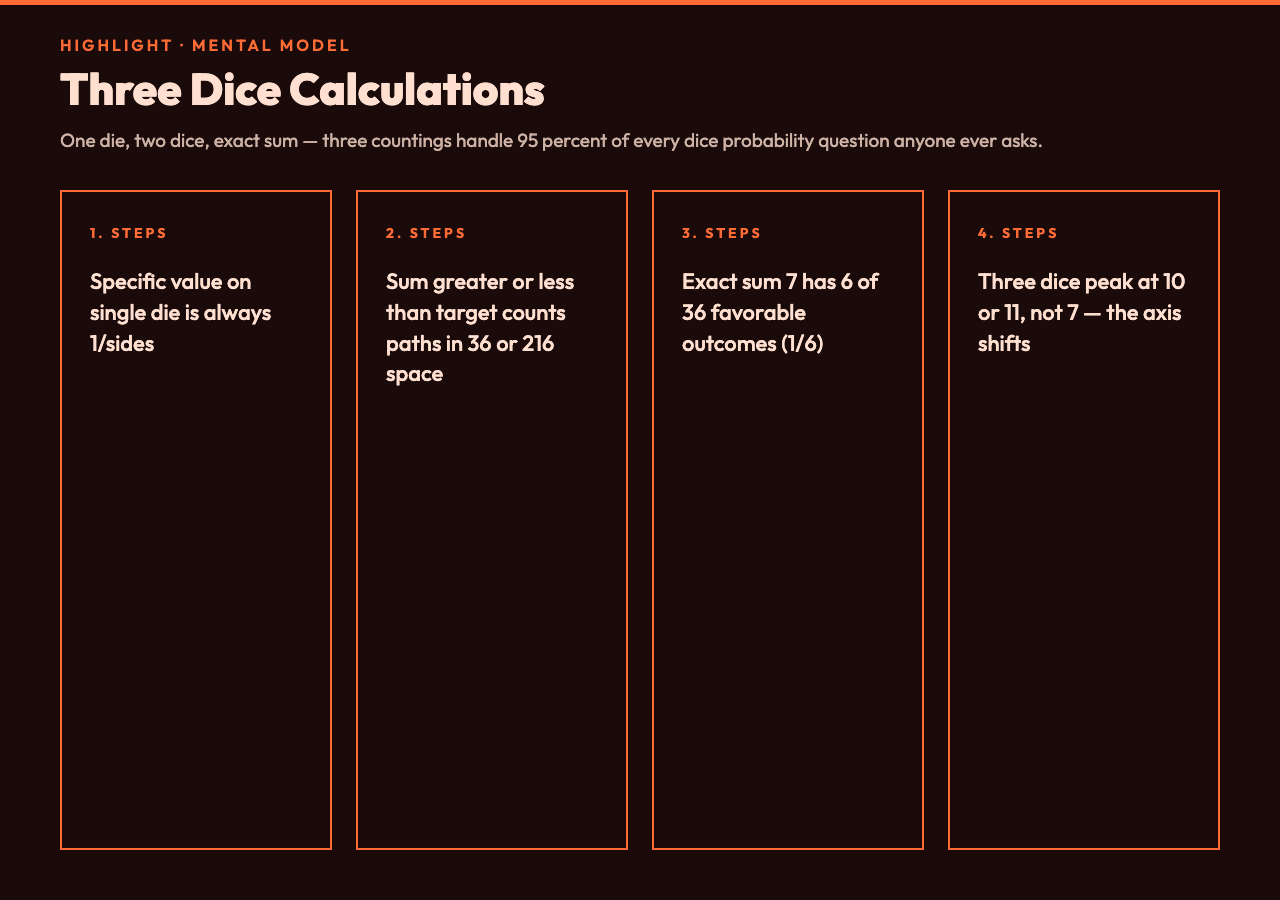
- Specific value on a single die: Always 1/sides. Doesn’t matter if sides is 4, 6, 8, 10, 12, or 20 — every face is equiprobable. The trap here is assuming “rolling high” is harder than “rolling low.” It isn’t; each face has the same probability by construction.
- Sum equal to or greater / less than a target: The probability that the total is at least X equals the count of (die-A, die-B) pairs whose sum reaches X, divided by 36. Symmetry means at-least-9 is the mirror of at-most-5: P(sum ≥ 9) = P(sum ≤ 5). For three dice, divide by 216 instead of 36.
- Exact sum of 7 (or any other target): This is the famous case — 6 favorable paths out of 36, giving 1/6 ≈ 16.67%. Each unit step away from 7 loses exactly one path on each side: sum 6 has 5 paths, sum 5 has 4, and so on. For d20s or d100s, use the calculator with appropriate numDice and diceSides rather than expanding 20^n by hand.
Why Three-Dice Probabilities Stop Looking Symmetrical
Add a third die and the distribution goes from triangle to bell-and-shoulders, peaking at 10 or 11 (since 10 and 11 each have 27 paths out of 216, while 9 and 12 have 25). The asymmetry on the tails is small but real: P(sum = 18) is 1/216, but so is P(sum = 3), and there’s a brief plateau in the middle (9 through 12 each sit between 25 and 27 paths) that doesn’t exist with two dice.
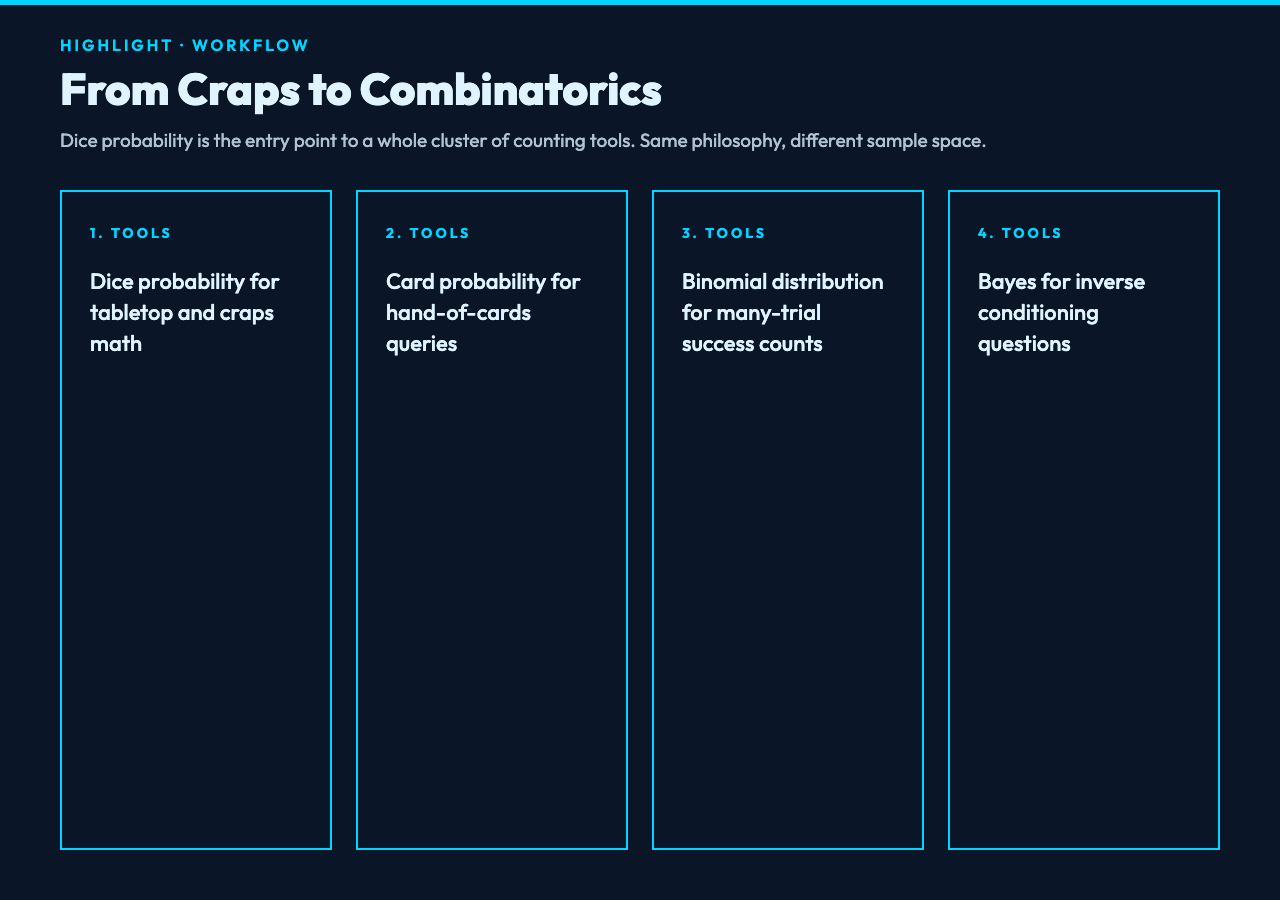
If you switch to non-standard dice — say, three 10-sided dice for a role-playing game — the peak shifts and so does the symmetry axis. A binomial distribution calculator handles the long-run case where you’re asking about successes across many independent trials, but for one-shot dice configurations, the dice tool is the cleanest entry point because the count stays small enough to enumerate.
The Three Traps That Produce Wrong Answers Even With Correct Math
Counting is mechanical once you internalize the sample space. The place where probability questions go wrong is at the boundary between “event I’m asking about” and “event I’m counting.” Three traps account for most errors:
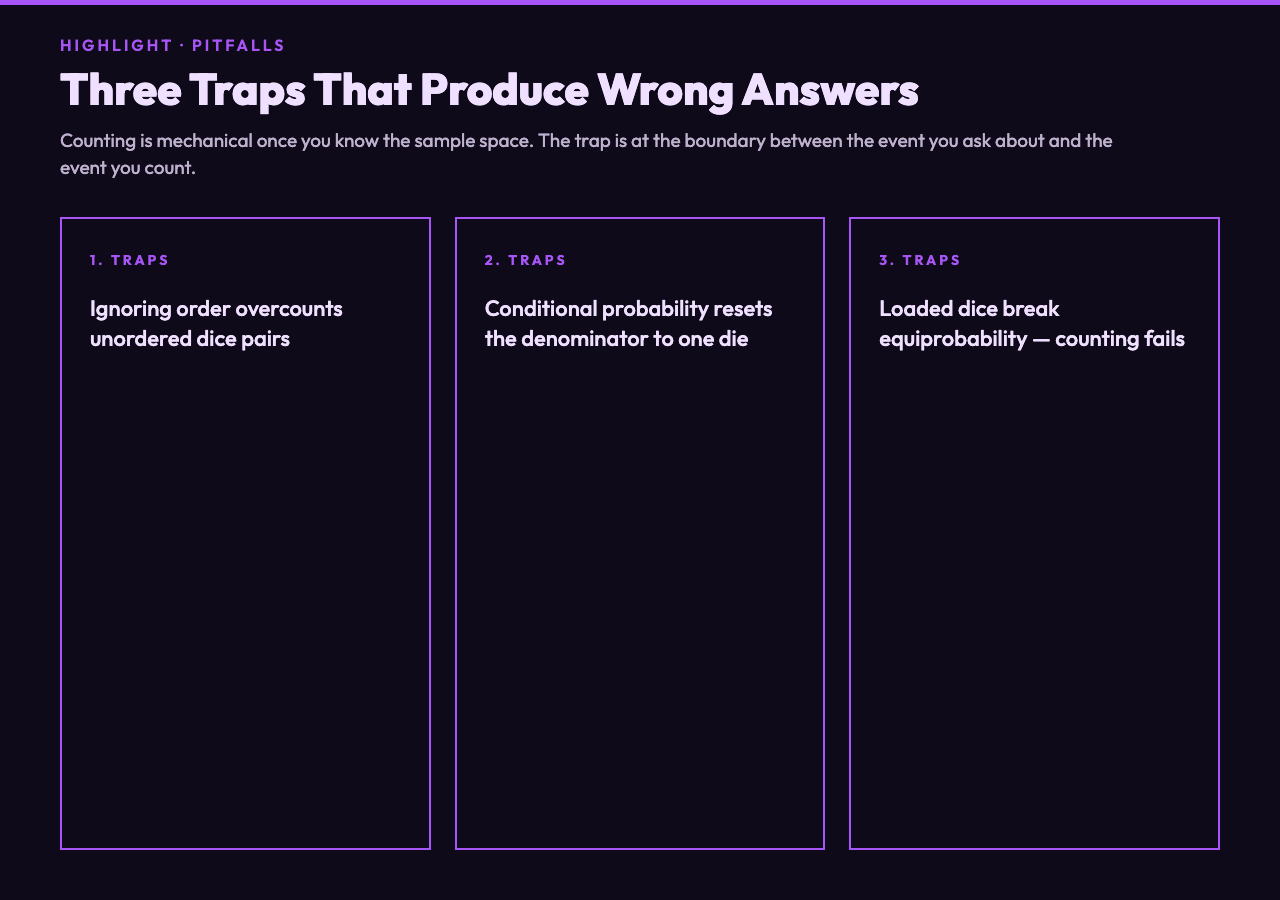
- Ignoring order: “Rolling a 3 and a 5” is the same as “rolling a 5 and a 3” if you only care about the unordered pair. But “what is the probability that die A is 3 and die B is 5″ is 1/36, not 2/36. The calculator handles this automatically because its enumeration is ordered, but if you’re hand-counting, decide first whether order matters.
- Conditional probability: “If I see one die is a 4, what is the probability the other is a 5?” is not 6/36. Once you condition on one die showing 4, the other has 6 independent equiprobable values, so the answer is 1/6, not 2/36. For multi-step games, a conditional probability calculator is the right tool.
- Loaded dice: If the dice aren’t fair — and many game dice aren’t perfectly balanced — equiprobability of faces fails, and every counting above becomes wrong. The calculator assumes uniform faces; if you suspect bias, you need empirical data, not theoretical counting.
Putting It Together: One Table, Five Calculation Types
If you remember nothing else, remember this: for any dice question, you either count (a) favorable outcomes and divide by total sample space (6 for one die, 36 for two, 216 for three, n^sides in general), or (b) use a known distribution (binomial for many trials, hypergeometric for draws-without-replacement) — and the Dice Probability Calculator is the simplest way to confirm any counting you did on paper. For more combinatorics-heavy problems, the Card Probability Calculator handles hands-of-cards cases, and the Bayes Theorem Calculator tackles the inverse-probability questions like “given that one die is showing even, what is the probability both are even.” These tools share the same counting-first philosophy — the math is never hidden, the counting is always visible.
The next time someone tells you craps is “all luck,” pull up the calculator, switch to two six-sided dice, select “Exact Sum” with target 7, and ask them to predict the probability before you click. About one in six, every time, indefinitely. That’s not luck, that’s a 6/36 hexagon, and it’s the same hexagon that powers Yahtzee scoring, Settlers of Catan robber rolls, and Dungeons & Dragons attack rolls. Once you see the shape, you see it everywhere.
Try the Dice Probability Calculator on your favorite game-night scenario, then explore more combinatorics tools at elysiatools.com.