

Pick the right functional groups, watch the conjugation toggle, and the carbonyl C=O band lands where textbooks say it should — without reaching for a spectroscopy database. Functional-group peak prediction is the cheat code every organic chemistry student rediscovers by second year: a carbonyl is a carbonyl, an ester is an ester, and the additive-increment model behind ChemDraw’s ChemNMR, nmrdb, and nmrshiftdb has been the operating assumption of spectroscopy teaching for decades. The NMR / IR Spectroscopy Peak Predictor compresses that additive model into a single panel — functional-group multiselect, an optional conjugation shift on carbonyls, an aromatic substitution pattern selector, and three independent toggle panels for IR / ¹H NMR / ¹³C NMR. Pick the groups, toggle the panels, and the simulated IR spectrum with annotated dips, ¹H and ¹³C signal ladders, and a carbonyl-family discrimination table all render in one view. The tool runs the same additive-increment model that LibreTexts, CU Boulder, NIU analytical tables, UCLA WebSpectra, and Chemguide teach — cross-verified ranges, not magic numbers.
Why Functional-Group Peak Prediction Reads More Honestly Than Spectral Search
Spectral database search treats every spectrum as a fingerprint — match the curve, ignore the physics. That works for identification but fails when you’re trying to learn why a peak moved. Functional-group peak prediction does the opposite: every predicted band is tagged with the structural feature that produced it, so a 1715 cm⁻¹ vs 1735 cm⁻¹ shift becomes a conjugation question, not a search-result question. The predictor encodes the textbook coupling constants, the n+1 rule, ring-current anisotropy for aromatics, H-bonding effects on OH/NH stretches, and Fermi resonance on CO₂⁻ bands — the same physics a professor will mark you down for missing on an exam.
The practical payoff: when a student asks “why is this ester carbonyl at 1735 but this conjugated enone at 1680?”, the answer is one toggle on the predictor, not one database query. See the Elysia Tools chemistry category for the wider set of additive-increment calculators that share this teaching-first pattern.
How the Additive-Increment Model Reads a Molecule
Pick the functional groups present (one per line in the input), set the aromatic pattern if any aromatic ring is in the molecule, and toggle “Apply conjugation shift to carbonyls” if any C=O sits next to a C=C. The predictor unions the band sets, applies the conjugation shift to the affected carbonyls, and renders three views: a simulated IR spectrum from 4000 to 400 cm⁻¹ with annotated dips, a ¹H NMR signal ladder from 0 to 12 ppm, and a ¹³C NMR signal ladder from 0 to 220 ppm. Each predicted band carries its physical cause — shielding, ring-current anisotropy, H-bonding, Fermi resonance, inductive effects — so a predicted dip at 1680 cm⁻¹ for an α,β-unsaturated ketone reads as “conjugation lowers C=O by ~25 cm⁻¹”, not just “1680 cm⁻¹”.
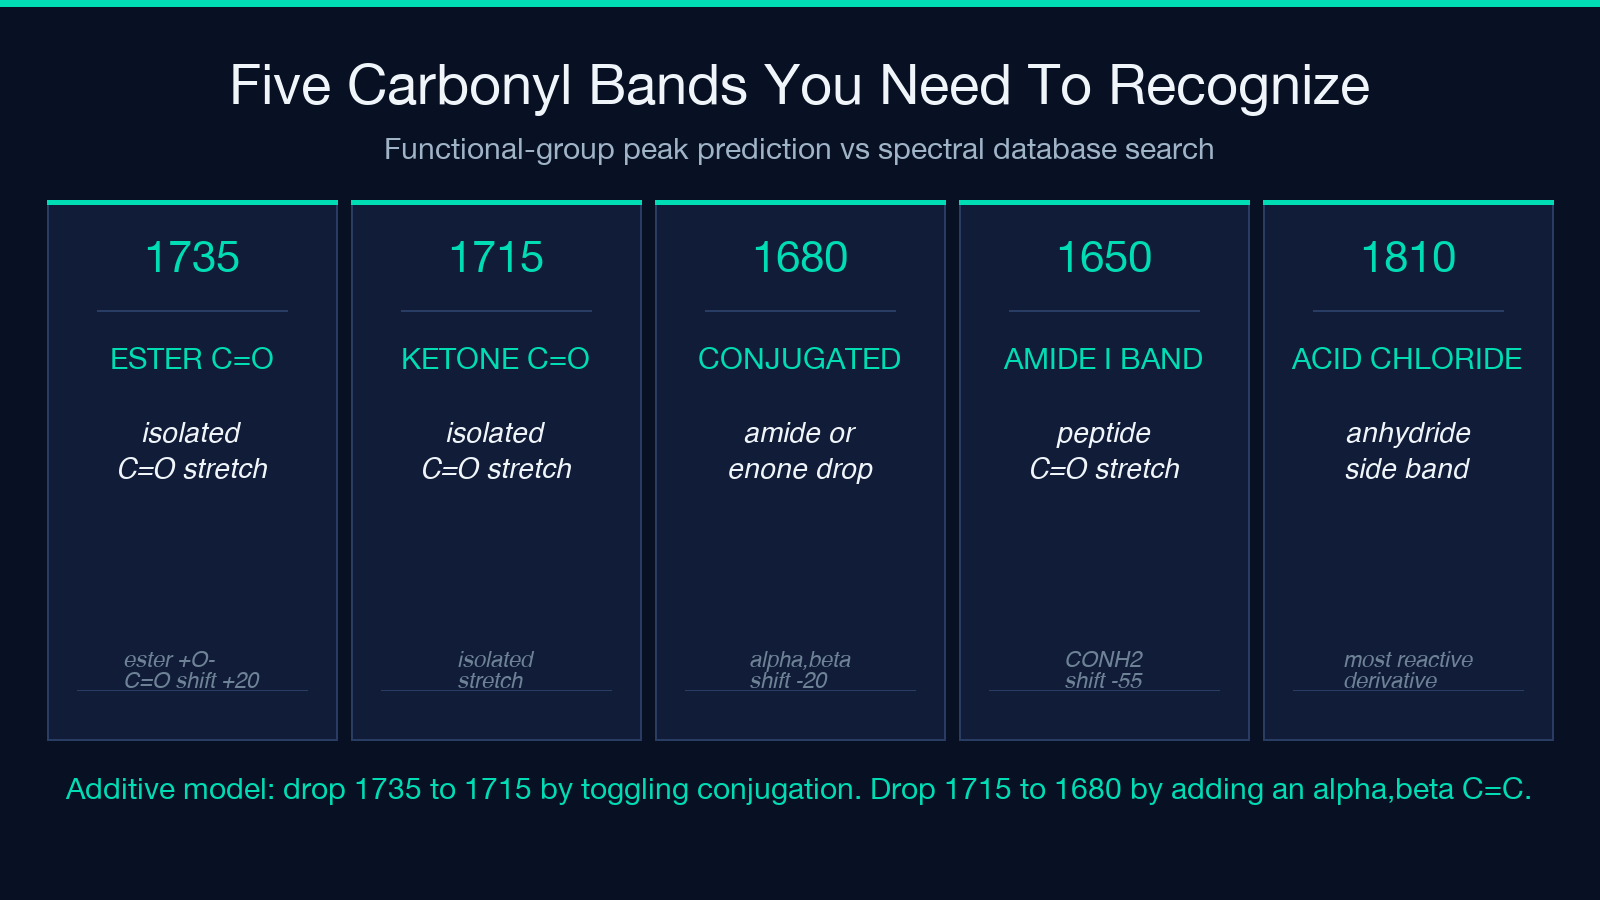
The carbonyl-family discrimination table inside the rendered output goes one step further: when the molecule has multiple carbonyl families (ester + amide, or ketone + aldehyde + carboxylic acid), the table lays the predicted C=O frequencies side-by-side so the student sees the 1735/1715/1680 separation in one row, not by scrolling. This is the same layout ChemDraw’s experimental IR table produces when you select “Show all expected bands” — a teaching comparison rather than a search match.
The Three Toggle Panels Are Independent, and That Is the Point
The IR / ¹H NMR / ¹³C NMR toggles are independent: a student studying IR alone can hide both NMR ladders and the simulated spectrum carries the whole story; a student studying ¹H coupling constants can hide IR and ¹³C and focus on the multiplet pattern. The n+1 rule and coupling-constant table inside the ¹H panel shows predicted J values for each neighbor-pair (³J ~ 7 Hz for a free-rotating CH₂–CH₃, ³J ~ 2 Hz for an allylic, ³J ~ 0 Hz for a methyl next to a carbonyl), which is the same set nmrdb annotates when you query a structure.
The aromatic substitution pattern selector (None / Monosubstituted / Ortho / Meta / Para) feeds into the ¹H aromatic window (6.5–8.5 ppm) and the IR out-of-plane bending region (900–700 cm⁻¹) — both characteristic patterns that fingerprint the substitution geometry. A para-disubstituted benzene shows two strong IR bends near 830–800 cm⁻¹; a meta shows three near 900–700 cm⁻¹; the predictor picks these up automatically when the pattern is set, no manual band selection required.
When Conjugation Is the Difference Between 1735 and 1680
The conjugation toggle is the single most-missed control on a first attempt. An isolated ester C=O absorbs at 1735–1750 cm⁻¹; an α,β-unsaturated ester drops to 1715–1730; a conjugated amide drops even further to 1680–1690. Without the toggle, the predictor renders the isolated frequency and the student wonders why their measured dip is 25 cm⁻¹ lower. With the toggle on, the rendered band shifts in real time and the cause annotation reads “conjugation lowers C=O” — the same one-line explanation Silverstein’s Spectrometric Identification of Organic Compounds gives.
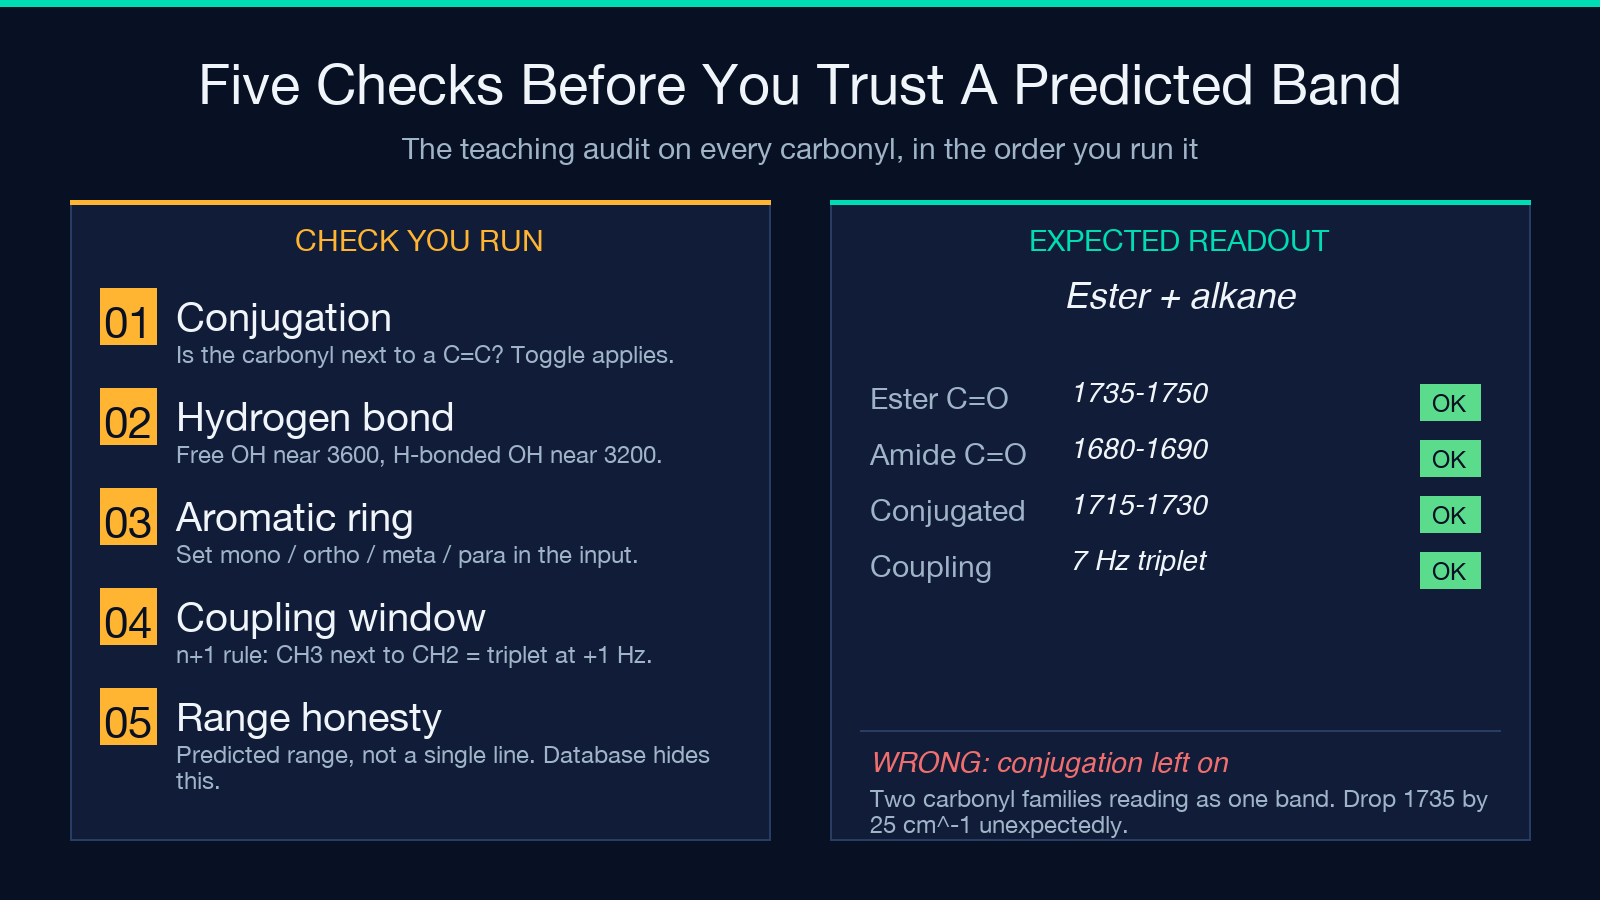
This is also where the carbonyl-family discrimination table earns its keep: when a molecule has both an isolated ester and a conjugated ketone, the table shows the 1735 and 1680 entries side-by-side, and the student sees the conjugation effect as a row-level difference rather than a memorized rule. A worked example on Elysia Tools walks through ethyl acetate + an α,β-unsaturated ketone as a two-row case.
Where the Predicted Ranges Diverge From a Real Spectrum — and Why That Is the Lesson
The additive model assumes isolated group contributions. In a real spectrum, hydrogen bonding can stretch an OH band 200–400 cm⁻¹ lower than the isolated prediction; Fermi resonance can split a single CO₂⁻ band into two; solvent shifts can move an aromatic ¹H by 0.2–0.5 ppm. The predictor surfaces these as cause annotations (“H-bonding” / “Fermi resonance” / “solvent”) next to the predicted band so the student sees the direction of the shift even when the magnitude is approximate. The teaching-first design is the point: a database search hides the physics, an additive prediction surfaces it.
This is also why the predictor returns a range (e.g. 1735–1750 cm⁻¹) rather than a single line — the range encodes the additive model’s uncertainty honestly. A real spectrum reading 1738 cm⁻¹ for an ester is inside the predicted range; a reading at 1715 would flag the conjugation toggle as missed; a reading at 1680 would flag a co-occurring amide or an α,β-unsaturated geometry.
Putting It Together on a Worked Example
Take ethyl acetate: ester + alkane. Toggle conjugation off, set aromatic pattern to None, show all three panels. The IR spectrum renders a strong dip at 1735–1750 cm⁻¹ with C–O support bands at 1300–1000 cm⁻¹; the ¹H ladder shows the 4.1 ppm O–CH₂ quartet, the 2.1 ppm acyl-side triplet, and the 1.2 ppm CH₃ triplet; the ¹³C ladder shows the ester carbonyl at ~170 ppm, the O–CH₂ at ~60 ppm, the acyl-side CH₂ at ~21 ppm, and the terminal CH₃ at ~14 ppm. Five predicted IR bands, five ¹H signals, five ¹³C signals — the exact shape nmrshiftdb returns for the same structure.
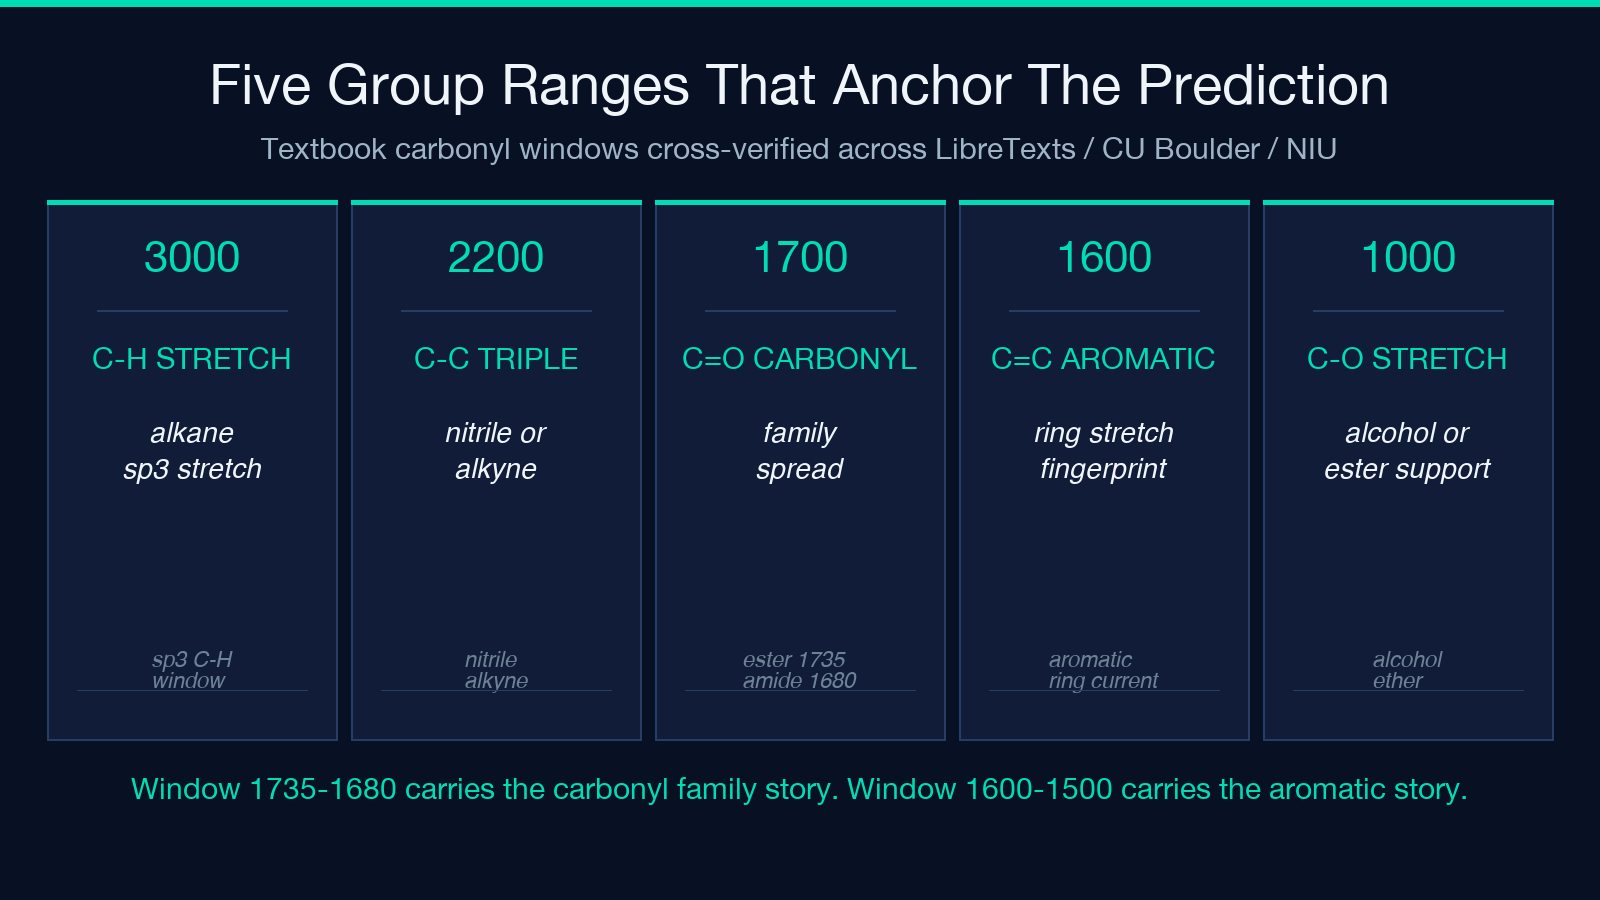
The carbonyl-family discrimination table on this input shows one row (ester, 1735–1750) — useful for confirming the input set was read correctly. Add an amide to the functional groups and the table grows to two rows: ester at 1735, amide at 1680, and the student sees the 55 cm⁻¹ separation that makes carbonyl family assignment tractable on a real spectrum.
Try It on Your Next Practice Problem
Open the NMR / IR Spectroscopy Peak Predictor, paste in three functional groups, leave conjugation off, and read the carbonyl family table — that single view is the fastest way to internalize the 1735 / 1715 / 1680 / 1650 progression that every spectroscopy exam tests. Then toggle conjugation on, watch the 1735 entry slide to 1715, and the shift is yours for next time. Explore more chemistry and spectroscopy tools at elysiatools.com.
