
Lead phrase. A raw QT interval on the ECG printout hides the part that matters most: how that interval behaves when the heart rate is fast, slow, or pharmacologically nudged. A 380 ms QT looks ordinary at 75 bpm and worrying at 130 bpm, and the only honest way to compare across patients — or across the same patient on two clinic visits — is to correct for rate. The three classical formulae (Bazett, Fridericia, Framingham) agree in the middle of the rate range and disagree at the edges, and picking the right one for the right scenario is the actual skill. This guide walks through what each formula is doing, when it bends, how to read the prolongation thresholds, and how the QTc Calculator at Elysia Tools lines up the three results side by side so the call you make at the bedside matches the math, not the habit.
Why a Raw QT Is a Lying Number
The QT interval shortens as the heart rate speeds up — that’s physiology, not pathology. A “normal” QT of 400 ms at 60 bpm and a “normal” QT of 360 ms at 100 bpm describe the same repolarization reserve. Bazett noticed this in 1920 and proposed dividing the QT by the square root of the RR interval, Fridericia proposed dividing by the cube root the same year, and Framingham proposed a linear correction in 1992. All three are rate corrections; they just disagree on the curve. The corrected value is what goes into the chart note, the drug-trial report, and the ICH E14 submission — and the choice of formula is the single biggest source of between-paper disagreement on what “QT prolongation” means.
What Each Formula Actually Computes
The three formulae are short enough to memorize and weighted enough to misunderstand.
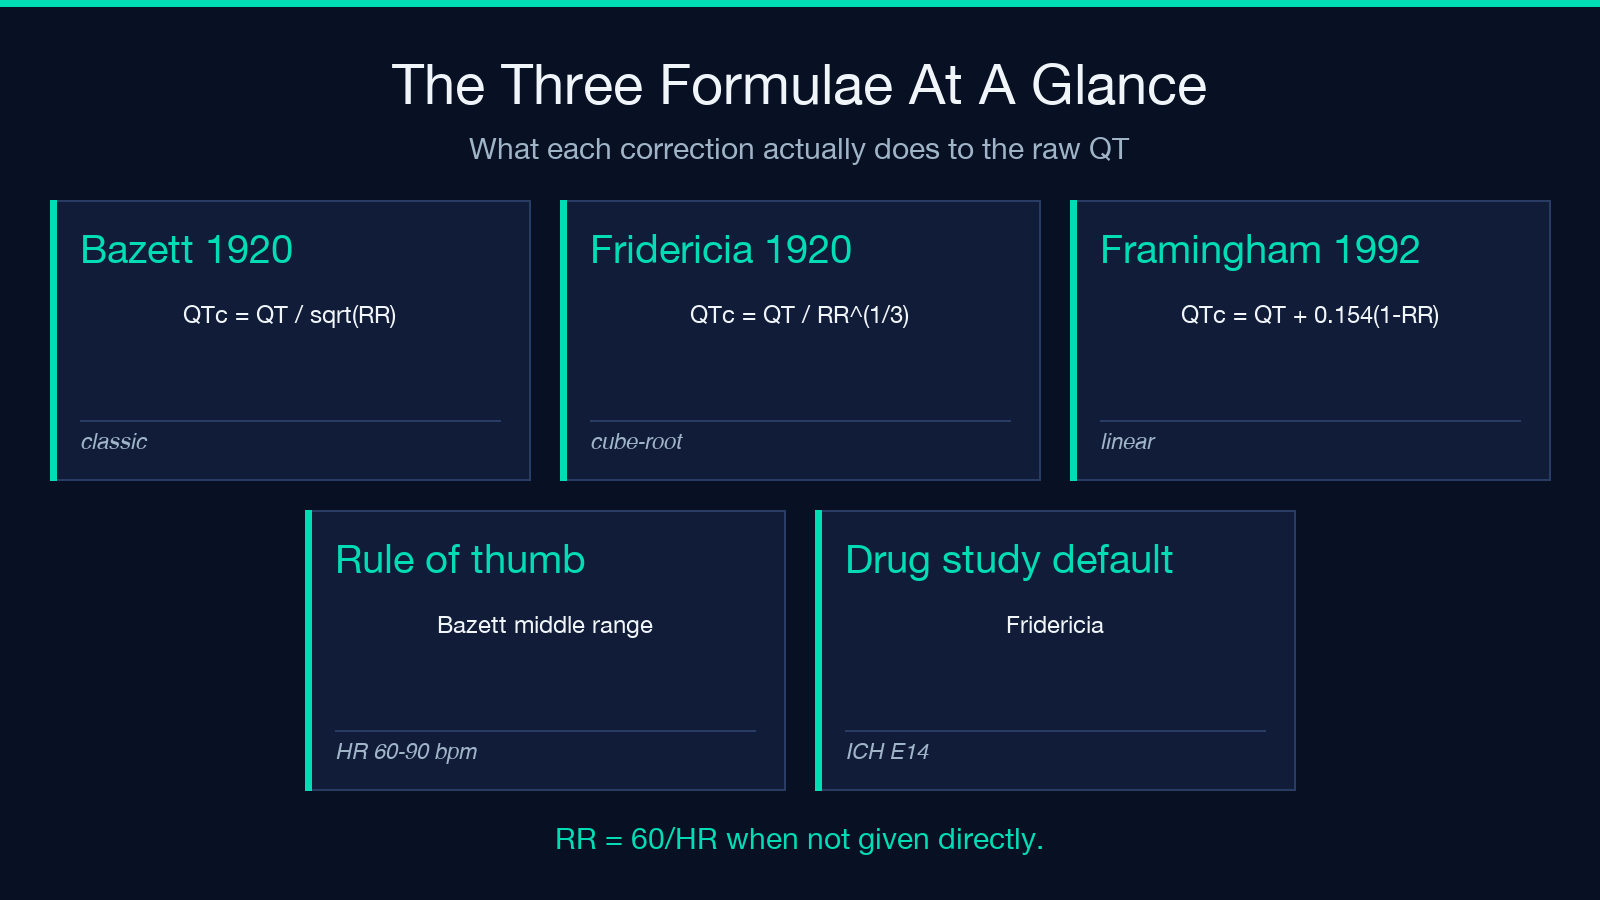
- – Bazett (1920):
QTc = QT / sqrt(RR). The classic. It over-corrects at high heart rates (a 360 ms QT at 130 bpm gives a 533 ms QTc, which reads as “markedly prolonged” even though the raw interval is unremarkable) and under-corrects at low heart rates. - – Fridericia (1920):
QTc = QT / RR^(1/3). The cube-root exponent flattens the curve at the extremes. Preferred for drug and QT studies and at the high-rate end (the post-exercise ECG, the tachycardia workup) because it does not inflate the corrected value into the danger zone on raw numbers that are physiologically fine. - – Framingham (1992):
QTc = QT + 0.154 * (1 - RR). A linear regression fit on the Framingham cohort. Robust at typical adult rates (60-90 bpm) and easy to do by hand when the calculator is on a different screen. Less accurate at the extremes, where the linear assumption bends away from the underlying curve.
RR is the interval between consecutive R waves in seconds; when you only have heart rate, RR = 60 / HR. The QTc Calculator computes RR from HR automatically and returns all three corrected values on a single input set, which is the only way to keep the comparison honest — running the same numbers through three calculators introduces three rounding differences.
Reading the Prolongation Thresholds
The AHA / ACC / HRS 2009 guidance and the ICH E14 regulatory framework agree on the cut-points, and they are sex-specific. For men, a QTc above 450 ms is borderline and above 480 ms is prolonged; for women, the borderline threshold is 460 ms and the prolonged threshold is 480 ms. A QTc above 500 ms is markedly prolonged regardless of sex and is the threshold that triggers the torsades de pointes conversation. In a drug study, a ΔQTc (change from baseline) above 30 ms is concerning and above 60 ms is clearly abnormal — that’s the ICH E14 positive-control signal that regulators use to validate a new compound’s cardiac liability.
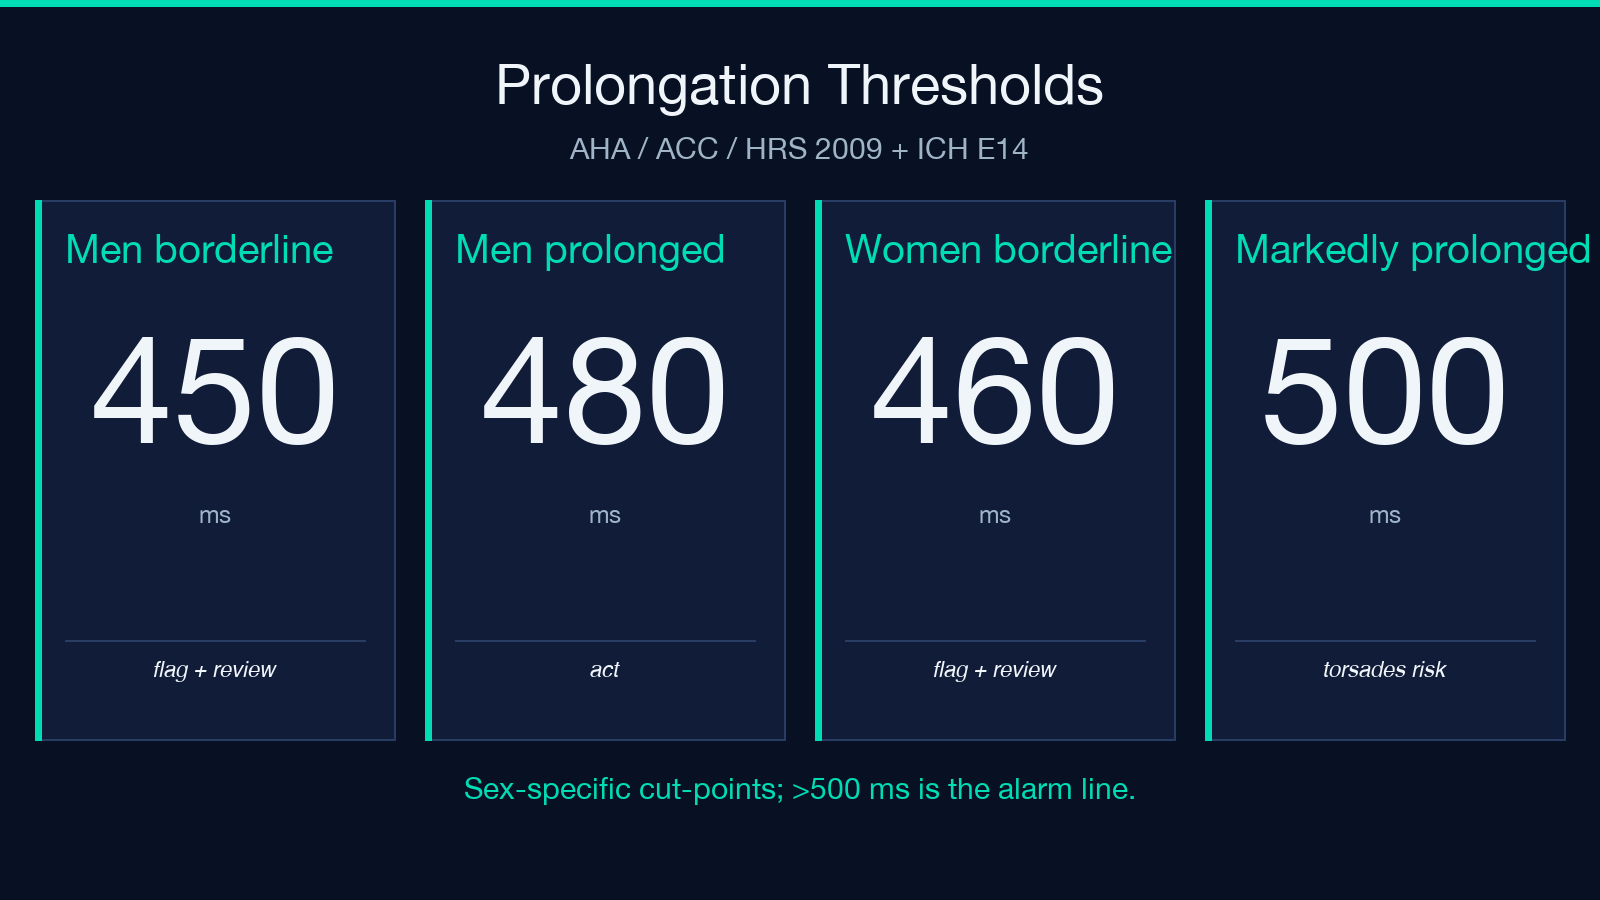
These thresholds are tied to the corrected value, not the raw QT. The same raw QT of 440 ms at 60 bpm gives a Bazett QTc of 440 ms (borderline in a man), and the same raw QT at 110 bpm gives a Bazett QTc of 596 ms (markedly prolonged) — and the patient hasn’t changed, only the rate has. Always pair the QTc with the formula and the heart rate when you write it in the note. A free-floating “QTc 470” without a method is uninterpretable.
Where Bazett Bends, Where Fridericia Wins
The literature converges on a practical rule: use Bazett in the middle of the rate range (60-90 bpm) where all three formulae agree to within a few milliseconds, use Fridericia at high rates (above 100 bpm) and in drug trials, and use Framingham when you only have a calculator-free moment and the rate is typical. The QTc Calculator at Elysia Tools returns all three values on the same screen so you can see the spread — a large spread (Bazett 510, Fridericia 470, Framingham 460) tells you the rate is at an extreme where the choice of formula is the answer; a tight spread (Bazett 460, Fridericia 458, Framingham 459) tells you the rate is well-behaved and the number is the number.
For drug studies specifically, the ICH E14 framework defaults to Fridericia or a study-specific linear correction; Bazett’s high-rate inflation can manufacture a “QT prolongation” signal out of a drug that is actually rate-neutral. When you review a CIOMS report or a clinical-trial appendix, the formula used is usually printed in the methods section; cross-check it against the heart-rate distribution of the cohort. A study at mean HR 70 bpm with Bazett is comparable to a study at mean HR 70 bpm with Fridericia; a study at mean HR 95 bpm with Bazett is not comparable to anything else.
How the Correction Handles Drug Interaction Risk
When two QT-prolonging drugs land on the same patient — say, azithromycin for a community pneumonia on top of ongoing haloperidol — the corrected value climbs faster than either drug alone would predict, and the right move is to run all three corrections before escalating. Bazett alone at 110 bpm can manufacture a QTc above 500 ms on a raw interval that is borderline, and the alarm triggers a workup that Fridericia would have spared the patient. The clinical habit is to look at the spread across the three formulae first and the number second. A spread under 10 ms across Bazett, Fridericia, and Framingham at any rate means the corrected value is stable; a spread over 30 ms means the rate is at an extreme and the formula choice is part of the answer. The QTc Calculator returns all three on the same screen so the spread is the first thing you see, not the last.
What Drives QTc Into the Danger Zone
The clinical precipitants of QT prolongation are well-mapped. QT-prolonging drugs — macrolides (azithromycin, clarithromycin, erythromycin), fluoroquinolones (especially moxifloxacin), class IA and III antiarrhythmics (quinidine, sotalol, dofetilide), antipsychotics (haloperidol, ziprasidone), methadone, and ondansetron — sit at the top of the list. Electrolyte derangements — hypokalemia, hypomagnesemia, and hypocalcemia — lower the threshold at which any drug becomes torsadogenic. Congenital long QT syndrome (LQTS, with the LQT1, LQT2, LQT3 genotypes) puts the patient on a shorter fuse from baseline. Bradycardia, acute ischemia, and hypothermia also prolong the QT and lower the margin for drug effect.
The clinical move when QTc climbs above the borderline threshold is to review the medication list, check the electrolytes, and correct what is correctable. The threshold to act is not the same as the threshold to alarm; a 470 ms QTc on a single ECG in an asymptomatic patient on a stable medication is not an emergency, but a 470 ms QTc on a patient who started ondansetron yesterday is a reason to stop the drug and recheck the next morning. The calculator is a screening tool, not a diagnostic one — it tells you whether the number warrants the next conversation, not what to do about it.
Pairing the Calculator With the Cohort
The QTc Calculator at Elysia Tools accepts the raw QT in milliseconds, the heart rate in bpm, the sex, and the formula, and returns all three corrected values together with the rate-normalized RR interval and the categorical band (normal / borderline / prolonged / markedly prolonged). The output is JSON-structured so you can paste a row of measurements into a spreadsheet and audit the cohort: which formula was used, which band each patient fell into, what the spread was across formulae. For a clinic running a baseline-and-follow-up ECG workflow, that audit row is what makes the QTc comparison reproducible across visits. Run a quick pass on your own last five ECGs and the spread across Bazett, Fridericia, and Framingham will tell you whether your cohort sits in the well-behaved middle of the rate range or at the edge where the formula choice is the answer.
The math behind the three formulae is short, the thresholds are well-published, and the only consistent error in QTc interpretation is to treat the corrected value as if it were the raw QT. Pair the number with the method and the rate, and the screening call falls out of the same arithmetic every time.
A Worked Example Across the Three Formulae
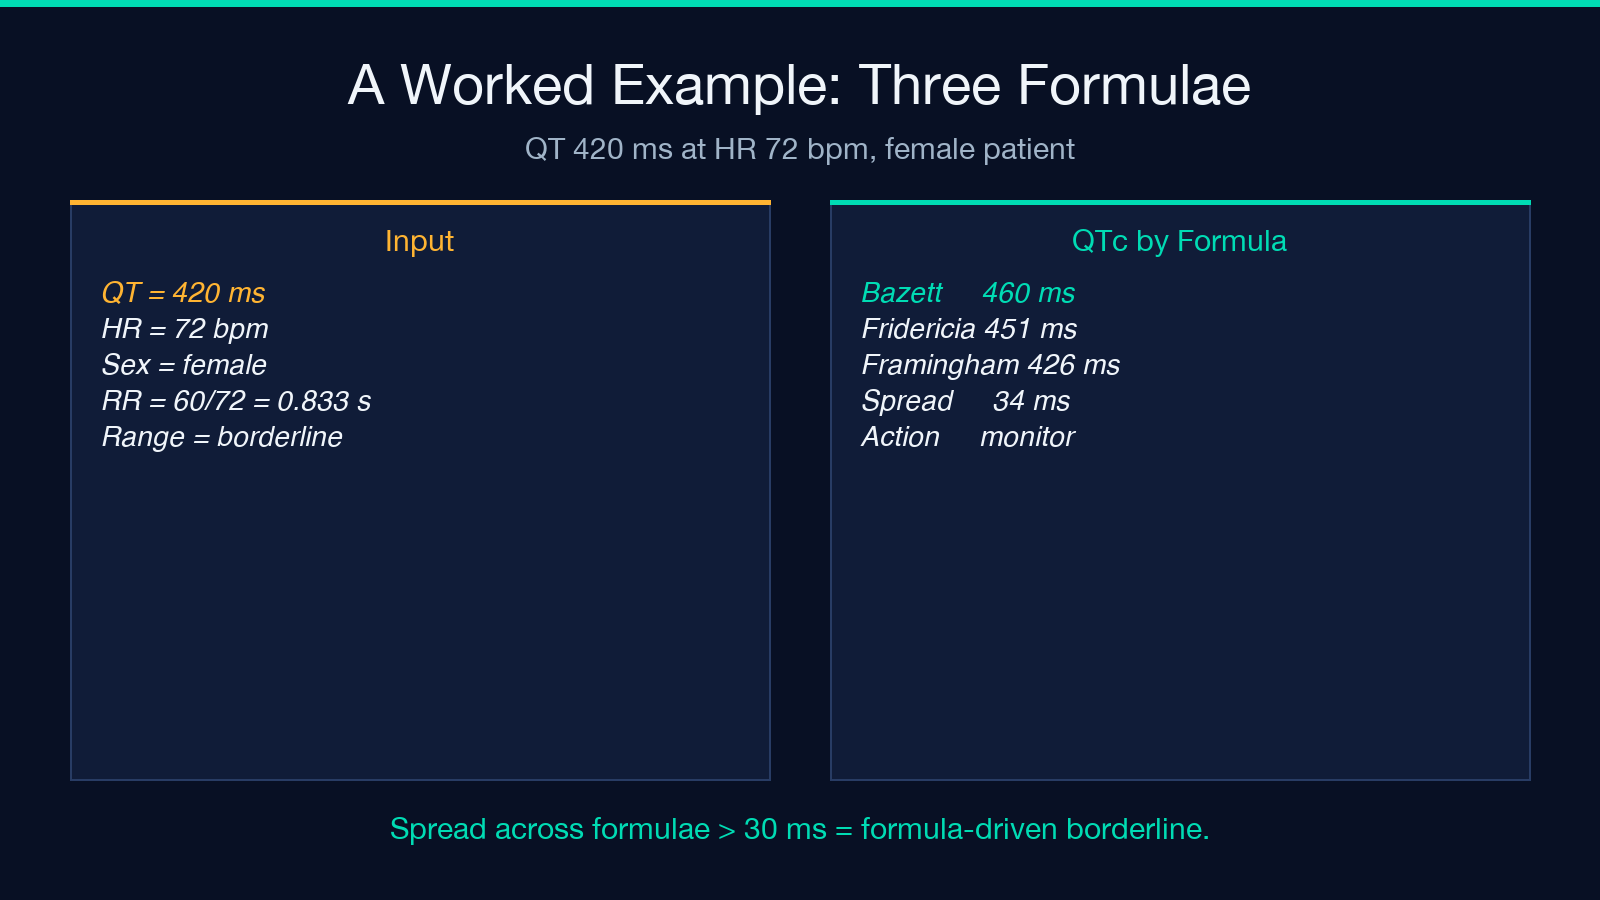
A 28-year-old woman on stable sertraline presents with a urinary tract infection; the covering clinician prescribes azithromycin and her baseline ECG that afternoon shows QT 420 ms at HR 72 bpm. RR = 60 / 72 = 0.833 s. Bazett: QTc = 420 / sqrt(0.833) = 460 ms — borderline in a woman. Fridericia: QTc = 420 / 0.833^(1/3) = 451 ms — also borderline, just inside the 460 ms threshold. Framingham: QTc = 420 + 0.154 * (1 – 0.833) = 420 + 0.026 = 426 ms — sits clean under the borderline cut-point. The spread across the three formulae is 34 ms (Framingham 426 to Bazett 460), which signals the rate is at a moderate position where the formula choice is the answer. The clinical move is to flag the azithromycin interaction, check potassium and magnesium, and recheck the ECG the next morning before the next dose. The single-number summary would be “QTc 460 borderline”; the three-number comparison tells the clinician that the borderline reading is formula-driven, that the underlying repolarization reserve is adequate at this rate, and that the screening call is to monitor, not to escalate to the coronary care unit.
Explore more tools at elysiatools.com.
