# The “Wah-Wah-Wah” Sound Your Piano Tuner Hears Means Something Deep
Here’s a strange thing: two sounds playing at nearly the same pitch create a third sound — a pulsing, rhythmic thudding that your ear perceives as *motion*. A piano tuner listens for exactly this. The moment those pulses vanish, the note is locked in tune.
This phenomenon — two almost-identical tones producing beats — is one of the most useful and least understood concepts in acoustics. And now there’s a free browser-based tool that lets you hear it, see it, and manipulate it in real time.
What You’re Actually Hearing
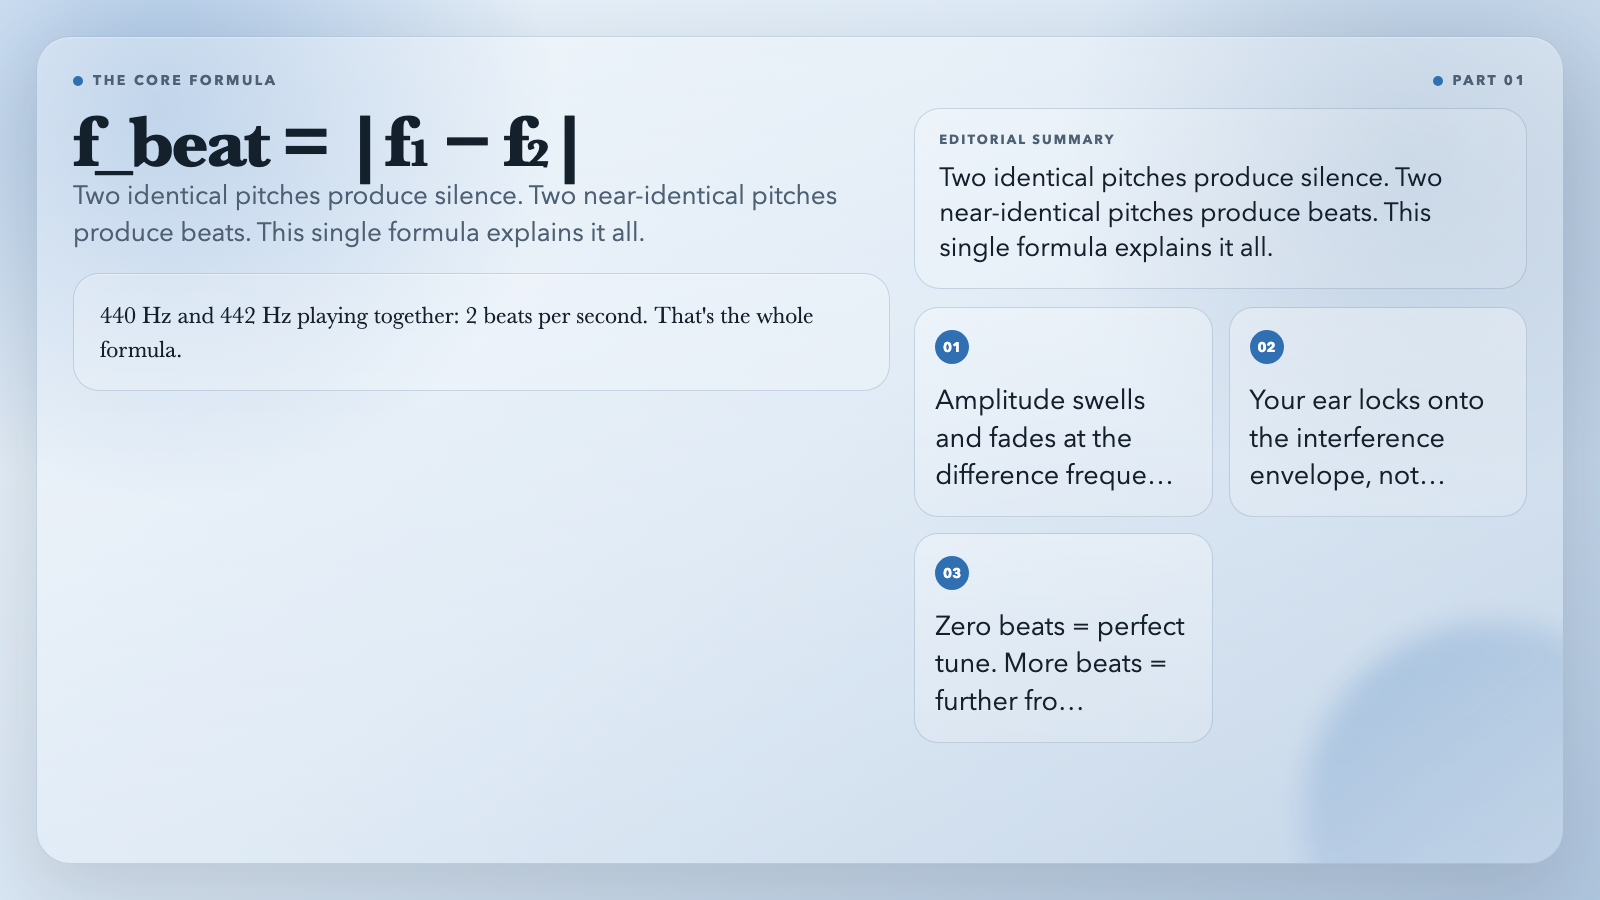
When two sound waves of different frequencies occupy the same space, they superpose — peaks stacking with peaks, troughs canceling troughs, and everything in between. The combined signal swells and fades at a rate equal to the absolute difference between the two frequencies:
> f_beat = |f₁ − f₂|
440 Hz and 442 Hz playing together: 2 beats per second. That’s the whole formula.
The first time you hear it, it sounds almost magical — like the air itself is throbbing. But it’s pure physics. Your ear cannot track two independent pitches when they’re this close. It locks onto the *envelope* of their interference instead.
Why Musicians Actually Use This
Every professional instrument tuning runs on beat frequency listening:
– Piano technicians count beats, not pitches. A perfectly tuned A4 at 440 Hz produces zero beats against a reference tone. Every mistuned note has a predictable, countable rate. Piano strings need constant retuning because string tension shifts with temperature and humidity — and each shift changes the beat rate the tuner counts.
– Orchestra concerts begin with an oboist playing a single A440. Every musician then adjusts, listening for beats to vanish at unisons, then vanishing again at octaves. The oboe is the reference because it’s the only woodwind that cannot adjust pitch after a note starts — no vibrato to hide behind.
– Synth producers deliberately detune two oscillators by 3–8 cents — creating 1–2 beats per second — for that thick, alive quality. The Roland JP-8000’s “SUPER SAW” waveform, the Yamaha CS-80’s undulating detune, Daft Punk’s “One More Time” — all run on this trick. It’s the secret behind nearly every big-room EDM lead since 1997.
This isn’t magic. It’s mathematics being exploited by every trained ear in music history.
What the Tool Actually Shows
The Beat Frequency Phenomenon visualization does three things simultaneously:
Waveforms — two inputs, one output. Watch Wave 1 (440 Hz) and Wave 2 (444 Hz) interfere in real time. The combined waveform’s amplitude swells and shrinks as the two parent waves shift in and out of phase. What you see is what you hear.
The envelope. A dashed line traces the amplitude modulation — the beat pattern itself. This is the “wah-wah-wah.” It is not a third sound. It is the *shape* of the loudness oscillation your brain extracts from the two-parent wave interference. The ear is fundamentally an envelope follower, not a Fourier analyzer.
Real audio output. Web Audio API synthesizes actual tones. Start with 2 Hz beats, then try 4 Hz, then 8 Hz. Notice what happens around ~15 Hz: individual pulses merge into a continuous texture and your brain starts perceiving a phantom lower tone. Your auditory system performs frequency subtraction whether you consent or not.
The Non-Obvious Part: “In Tune” Is Relative
Musical tuning and frequency identity are not the same thing.
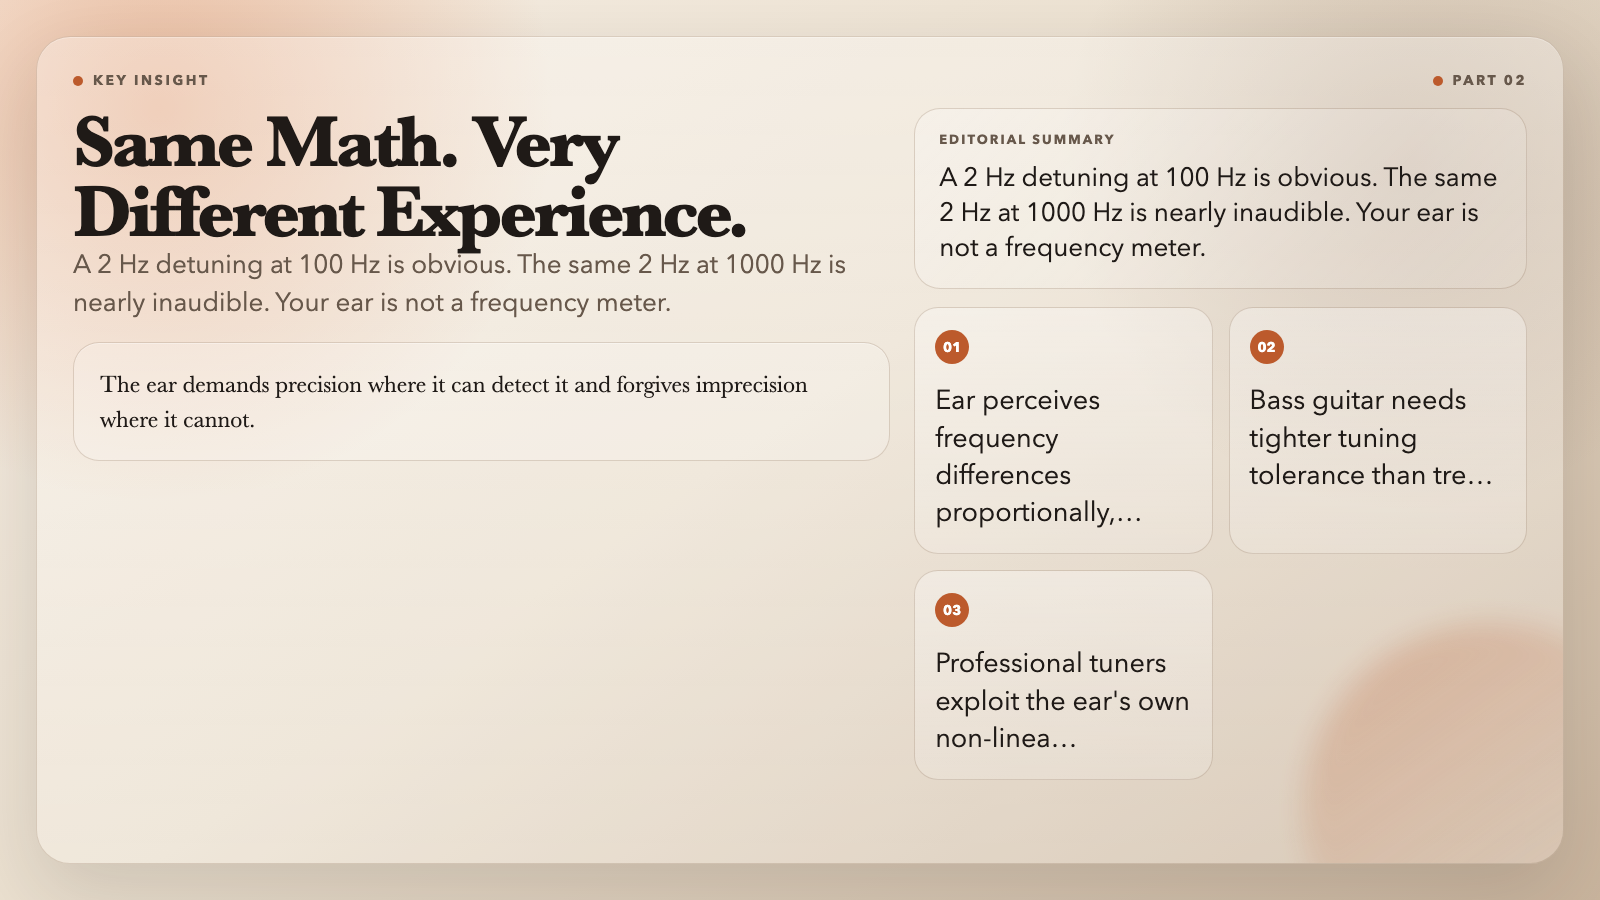
A 100 Hz tone and a 102 Hz tone — 2 Hz apart — produce obvious beats. A 1000 Hz tone and a 1002 Hz tone — also 2 Hz apart — are nearly indistinguishable. Your ear perceives frequency differences *proportionally*, not linearly. The same mathematical difference produces radically different perceptual severity.
This is why a bass guitar slightly out of tune sounds *muddy and wrong*, while the same pitch error in the treble sounds only mildly bright. Same frequency delta. Very different human experience. Professional tuners exploit this daily: tighter tolerances in the bass, looser tolerances in the treble. The ear demands precision where it can detect it and forgives imprecision where it cannot.
Where Beat Frequency Shows Up Outside Music
The physics extends well beyond concert halls:
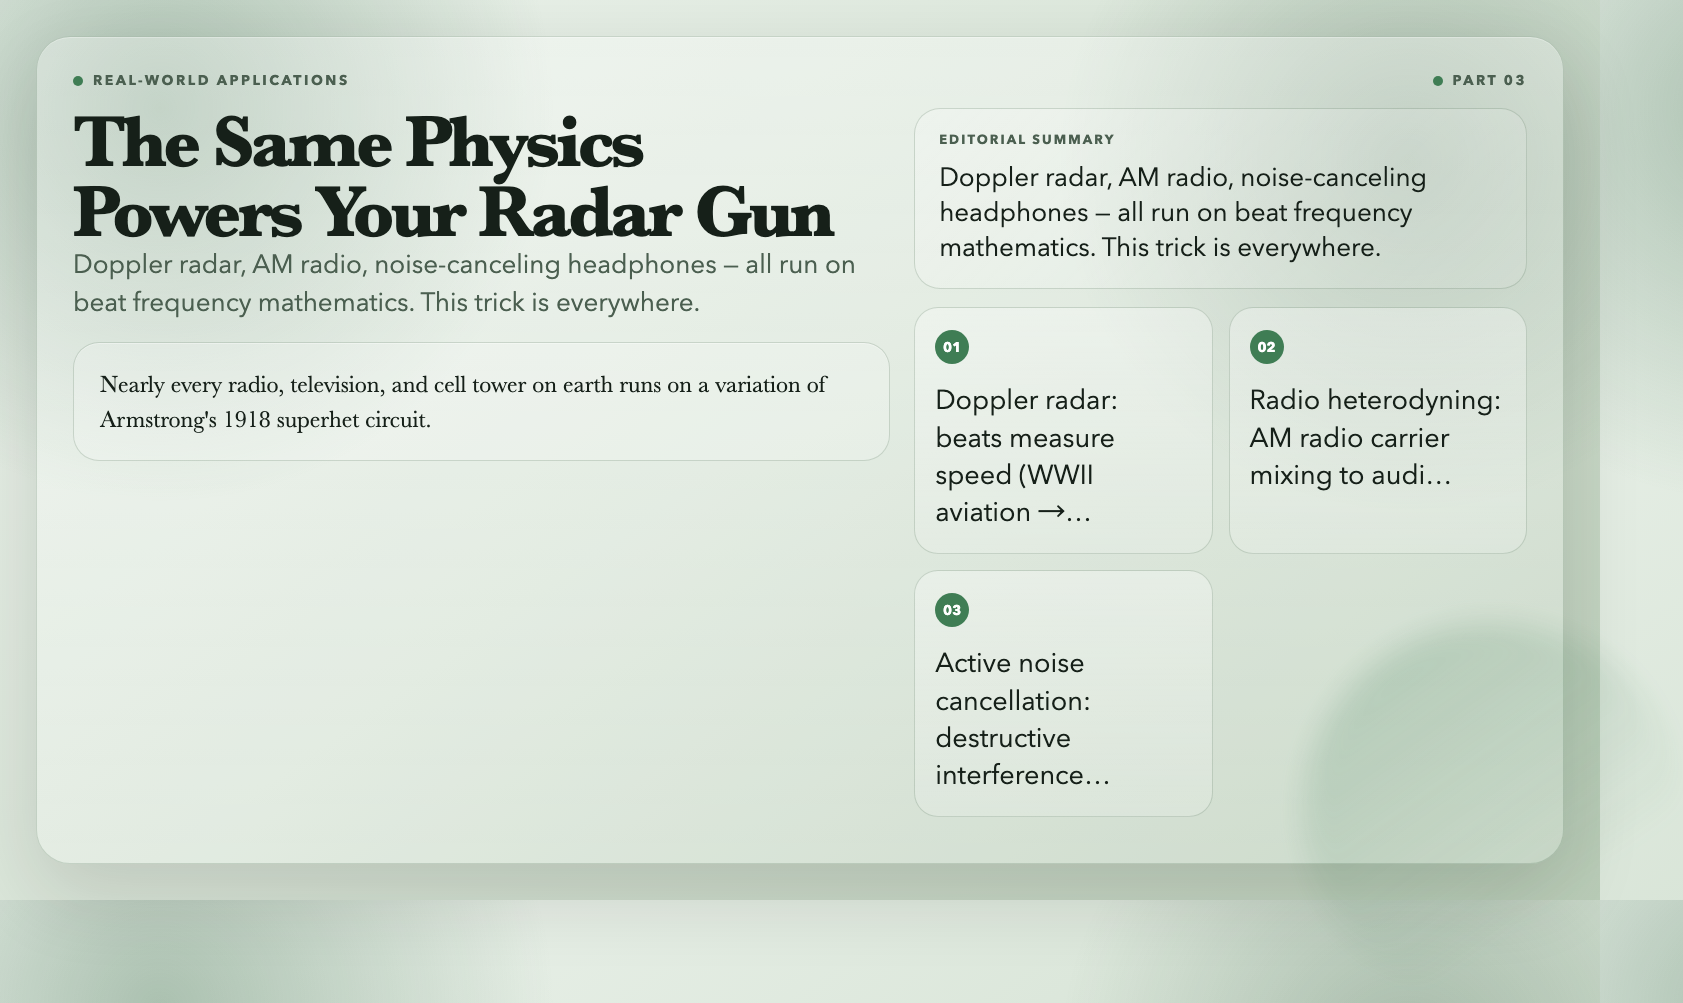
– Doppler radar — same principle measuring your highway speed — mixes a transmitted signal with its reflected return and counts the resulting beats. Larger frequency shift = faster object. First used in aviation during WWII, now standard in weather tracking and speed enforcement worldwide. The weather radar showing you tonight’s storm uses this math. The officer’s speed gun uses this math.
– Radio heterodyning — the technology behind AM radio — mixes incoming high-frequency carriers with a local oscillator to produce audible beat frequencies carrying the original audio. Edward Howard Armstrong invented the superhet receiver in 1918 on this principle. Nearly every radio, television, and cell tower on earth runs on a variation of his circuit.
– Active noise cancellation — your noise-canceling headphones sample ambient sound and generate inverse waveforms that destroy it via destructive interference. Same math, running in reverse. The whoosh you hear on airplanes? That’s beat frequency cancellation doing its job.
Beat frequency isn’t just a musician’s trick. It’s wave physics hiding in plain sight everywhere signal processing occurs.
Run the Experiment
The tool includes presets for building genuine intuition:
– Slow Beat (2 Hz): 440 Hz and 442 Hz. Loudness swells and fades every half-second. This is what a piano tuner listens for.
– Moderate (4 Hz): 440 Hz and 444 Hz. Rhythmic throb, distinct and engaging.
– Fast (8 Hz): 440 Hz and 448 Hz. Individual pulses begin merging into a texture.
– Tuning Fork: 440 Hz and 442 Hz — the exact frequencies that define concert pitch worldwide.
Then: switch from sine waves to square waves while keeping the beat frequency identical. Listen carefully.
The rate of amplitude modulation is exactly the same. The formula doesn’t change. But square waves produce harsh, aggressive beats while sine waves produce smooth, gentle ones. Same math. Radically different sensory character.
Here’s the question that should bother you after you try it: if the formula is identical and the physics is identical, why does perception change so dramatically? What is your auditory system doing that the equation doesn’t predict?
That gap between formula and experience? That’s where the interesting questions live. Try it at elysiatools.com/en/visualizations/beat-frequency — no download, no signup. Just open the page and run the square wave test. Then ask yourself what else you’ve been getting wrong about how sound works.
*More free audio experiments on ElysiaTools: Audio Resample, Audio Chorus, Audio Compressor.*