Why Binary Phase Diagrams Are the Most Powerful Tool in Materials Engineering
When an engineer designs a new aluminum alloy for aircraft wings, they don’t trial-and-error different compositions in a furnace. They open a phase diagram.
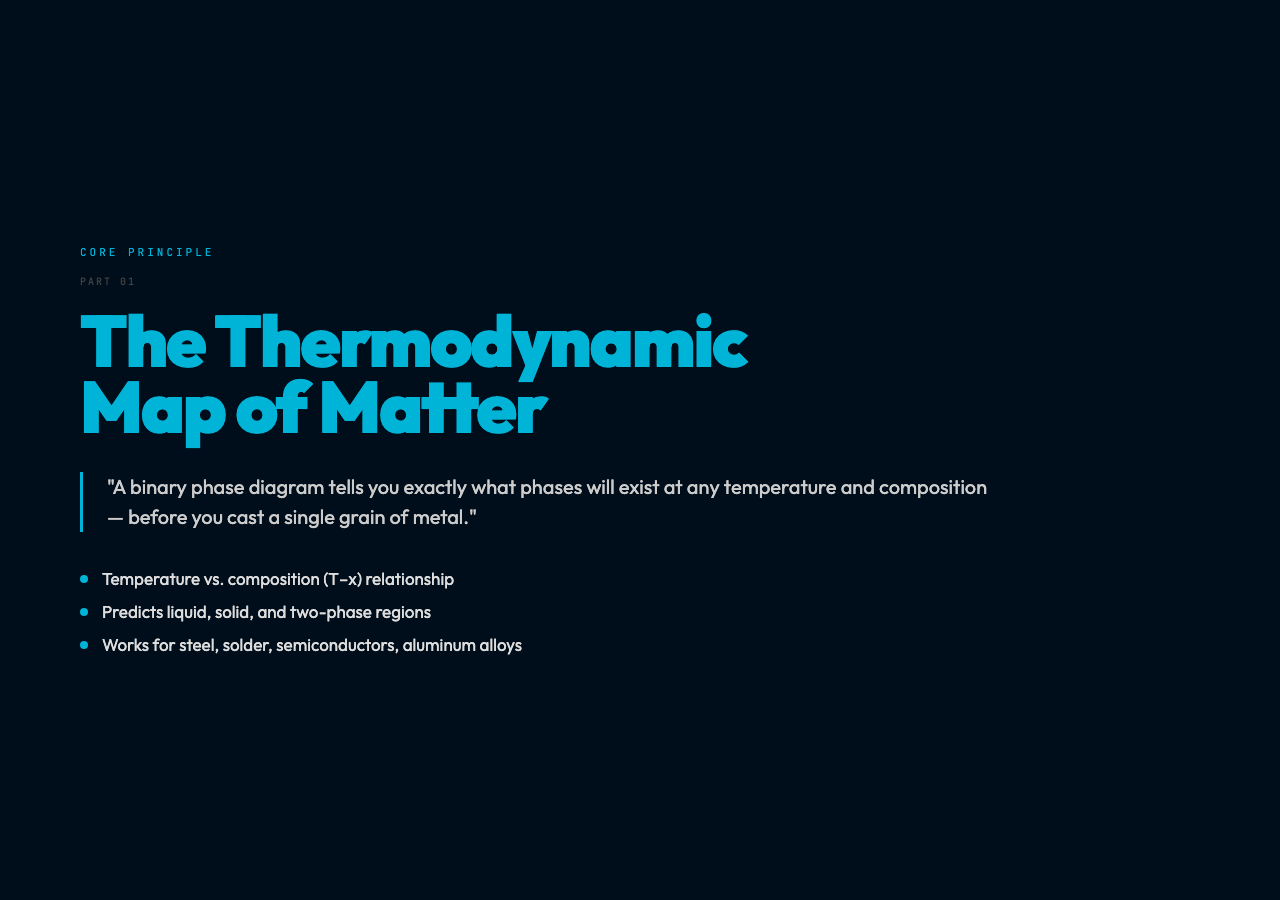
This one chart tells you exactly what phases will exist at any temperature and composition, where the eutectic point lies, and how to predict microstructure before casting a single grain of metal. It’s the kind of tool that condenses years of thermodynamic intuition into a single two-dimensional map.
The Binary Phase Diagram Simulation on ElysiaTools lets you explore these diagrams interactively — adjusting composition, watching the lever rule in action, and seeing how microstructures evolve as an alloy cools.
What Is a Binary Phase Diagram, Exactly?
A binary phase diagram maps the equilibrium phases in a two-component system as a function of temperature and composition. “Binary” means two elements — say, copper and nickel, or lead and tin. “Phase” means a physically distinct state: solid, liquid, or a specific crystal structure.
At high temperatures, most binary systems form a complete liquid solution. As you cool, the liquid may freeze into one or more solid phases. The diagram shows you exactly where these transitions happen.
The chart has temperature on the vertical axis and composition (typically in weight percent of one component) on the horizontal axis. Each region of the diagram tells you which phase or phases are thermodynamically stable under those conditions.
The most familiar binary diagram is the lead-tin system used in soldering. But the same principles apply to steel (iron-carbon), semiconductor wafers (silicon-germanium), and the aluminum-lithium alloys being developed for next-generation aircraft.
The Three Regions Every Engineer Reads First
The Liquidus
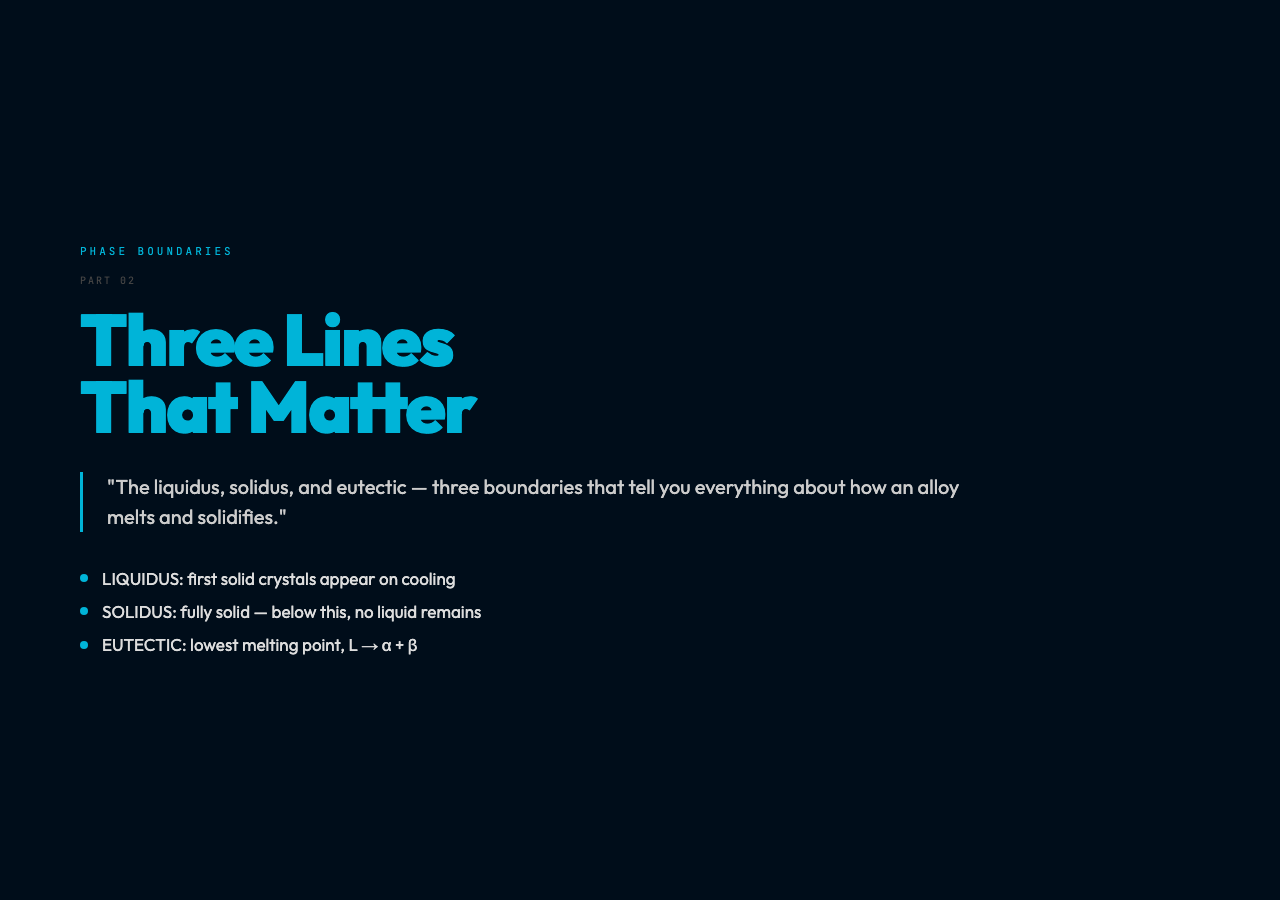
Above the liquidus line, the entire system is molten. Crossing the liquidus means the first solid crystals begin to appear. In the simulation, watch how the liquidus boundary shifts as you adjust the composition slider.
For a pure element, the liquidus is a single point — the melting point. For a binary alloy, it’s a curve. This curve is why alloy melting isn’t sharp: aluminum alloys don’t melt at one temperature, they start to solidify over a range.
The Solidus
Below the solidus line, the system is completely solid. Between liquidus and solidus lies a mushy zone where both liquid and solid coexist — like a slushie. This region matters enormously for casting: too much solid fraction and the metal won’t flow; too little and you get shrinkage defects.
The Eutectic Point
The eutectic is the lowest-melting composition in the system — the point where liquid transforms directly into two solid phases simultaneously. The reaction looks like this:
L → α + β
Lead-tin solder is a eutectic alloy (about 63% tin, 37% lead). Its eutectic melting point of 183°C is far below the melting points of either pure lead (327°C) or pure tin (232°C). This is why eutectic compositions are prized in joining applications: they melt and solidify at a single, predictable temperature.
The Lever Rule: Reading Phase Fractions at a Glance
Once you’re in a two-phase region — say, liquid plus alpha solid — you often want to know what fraction of the material is liquid versus solid. The lever rule answers this with a geometric trick.
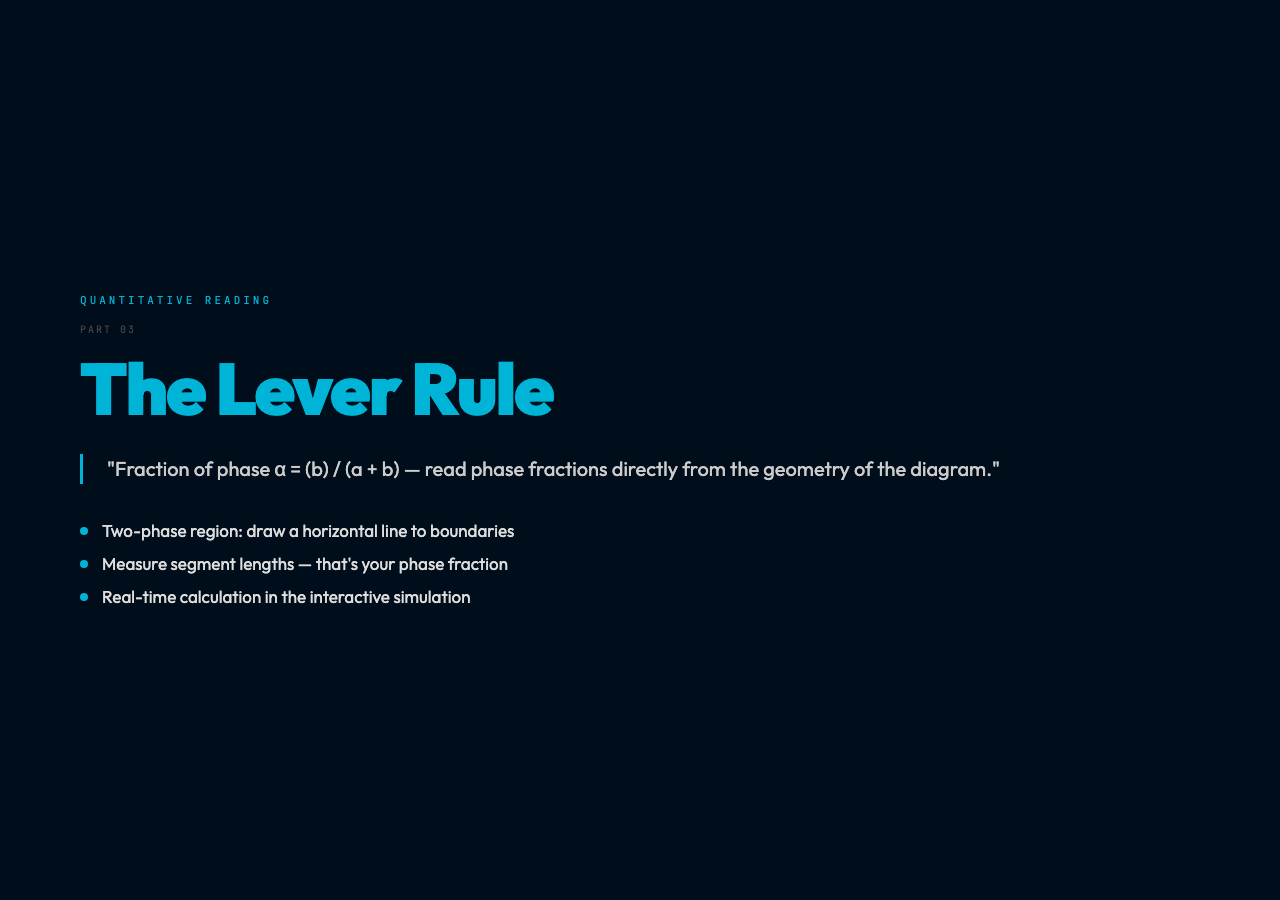
Pick a point in the two-phase field. Drop a horizontal line to the phase boundaries. You now have a “lever” with the fulcrum at your operating point and the ends at the two phase boundaries.
The fraction of phase 1 equals the length of the lever arm opposite phase 2, divided by the total lever length. In other words: fraction of α = (b) / (a + b), where a and b are the segment lengths on the diagram.
The simulation calculates these fractions in real time as you move the composition and temperature. It’s a much more intuitive way to internalize the rule than staring at a textbook equation.
Microstructure Evolution: What You See as Metal Cools
The phase diagram predicts thermodynamics. But what does the microstructure actually look like as an alloy solidifies?
This is where the diagram becomes genuinely beautiful.
As an off-eutectic alloy (say, 70% copper, 30% nickel) cools from the liquid, the first solid to form is a copper-rich alpha phase. As cooling continues, the composition of the remaining liquid shifts toward the eutectic composition. At the eutectic temperature, the remaining liquid transforms into a fine lamellar mixture of alpha and beta — alternating layers too small to see with the naked eye but visible under a microscope.
This is why microstructure matters: the mechanical properties of a cast alloy depend not just on composition, but on the size, shape, and distribution of these microstructural features. A hypoeutectic alloy (composition below eutectic) will have primary alpha dendrites with eutectic filling the spaces between. A hypereutectic alloy will have primary beta particles instead.
Why This Tool Is Worth Bookmarking
The Binary Phase Diagram Simulation handles a non-trivial set of features for a free web tool:
– Interactive T-x diagram: drag the temperature and composition markers to explore any point on the phase map – Real-time lever rule calculation: see phase fractions update as you move – Microstructure display: visualize what primary phases and eutectic structures look like at different compositions – Key point annotations: eutectic, peritectic, and composition endpoints are labeled
Whether you’re a materials science student learning the fundamentals, an engineer quick-checking a phase transformation, or a hobbyist metallurgist trying to understand why your pewter casting cracked — this simulation gives you the diagram you need without installing Thermo-Calc or Pandat.
The Takeaway
Phase diagrams are thermodynamic maps. They compress enormous experimental data into a form your brain can actually use. Once you know how to read the liquidus, solidus, eutectic, and lever rule — and can see them in action simultaneously — you have a mental model that transfers across every alloy system you’ll ever encounter.
The binary phase diagram isn’t just a chart. It’s a language for talking about matter at the atomic scale.