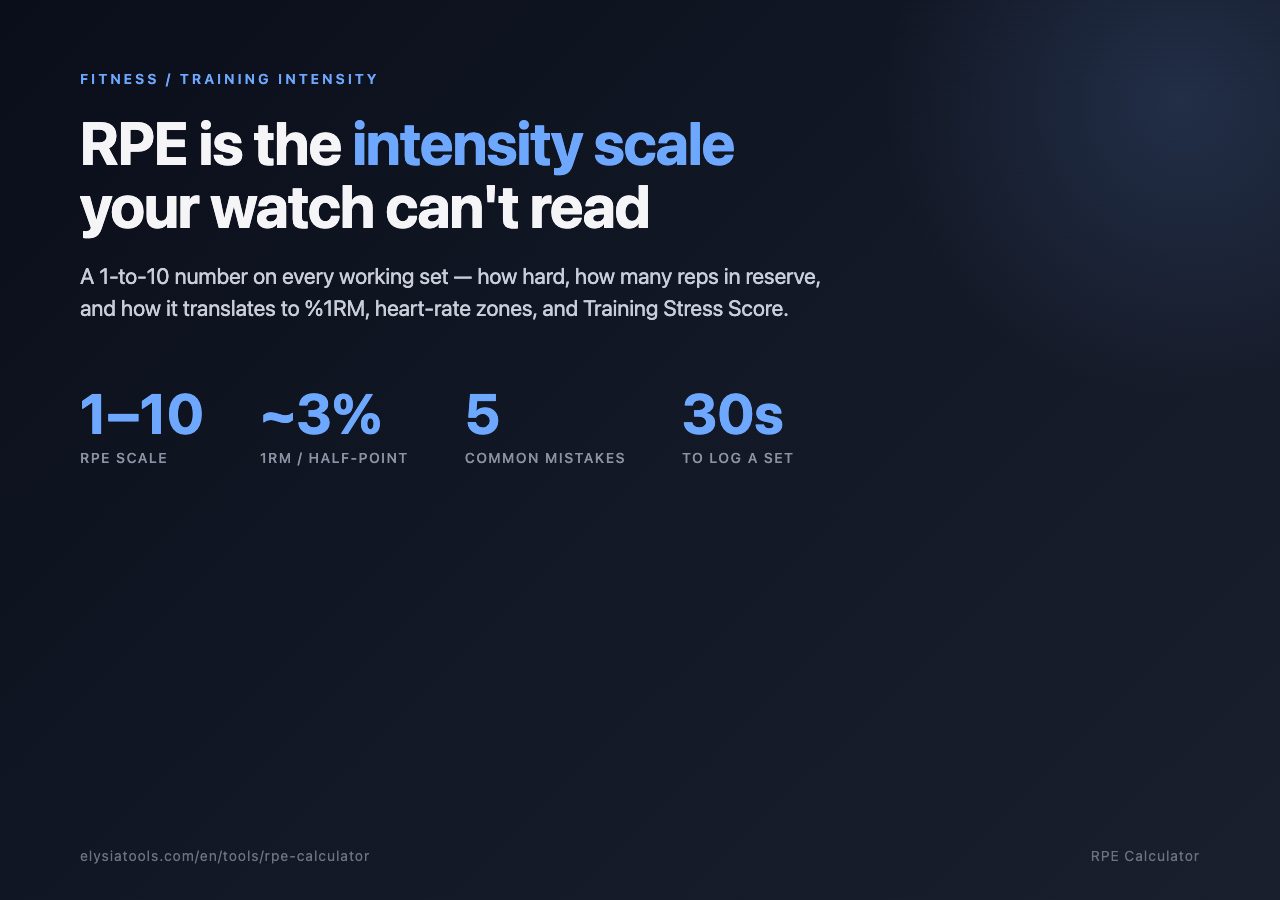
If your training log shows “3×8 at 70 kg” and nothing else, you’re reading a recipe without knowing how it tasted. The weight is the input, but the response — how hard that last rep actually felt, whether you had one in the tank or zero, whether you could have done nine — is invisible until the next session finds out for you. Rate of Perceived Exertion (RPE) is the cheapest way to make that response visible: a 1-to-10 scale you attach to every working set, costing no equipment and no extra session, but changing how every future session gets programmed. The RPE Calculator at Elysia Tools takes that single number plus a duration and returns a usable training-intensity estimate you can stack against heart-rate data and Training Stress Score without a power meter in sight.
The mental shift is small but consequential. Most lifters under-rate hard sets by about a point on the RPE scale and over-rate easy ones by about the same amount — both errors shrink with practice but never fully disappear, because the scale is anchored to reps in reserve, not to a feeling. RPE 10 means zero reps left; RPE 9 means one; RPE 8 means two. A set you log as “RPE 8” tells the next program that you had two more reps in you. A set you log as “RPE 10” tells it you were done. The number doesn’t replace your watch’s HR data; it tells a different story about the same session.
The 1–10 Scale in Plain Language
The original Borg scale ran from 6 to 20 and was designed for cardiac patients walking on a treadmill. Mike Tuchscherer’s RPE — the one strength athletes use — collapses the same idea into a 1-to-10 range tied to reps in reserve, because the question “could I have done another rep?” is the question a strength program actually wants answered.
A working translation looks like this:
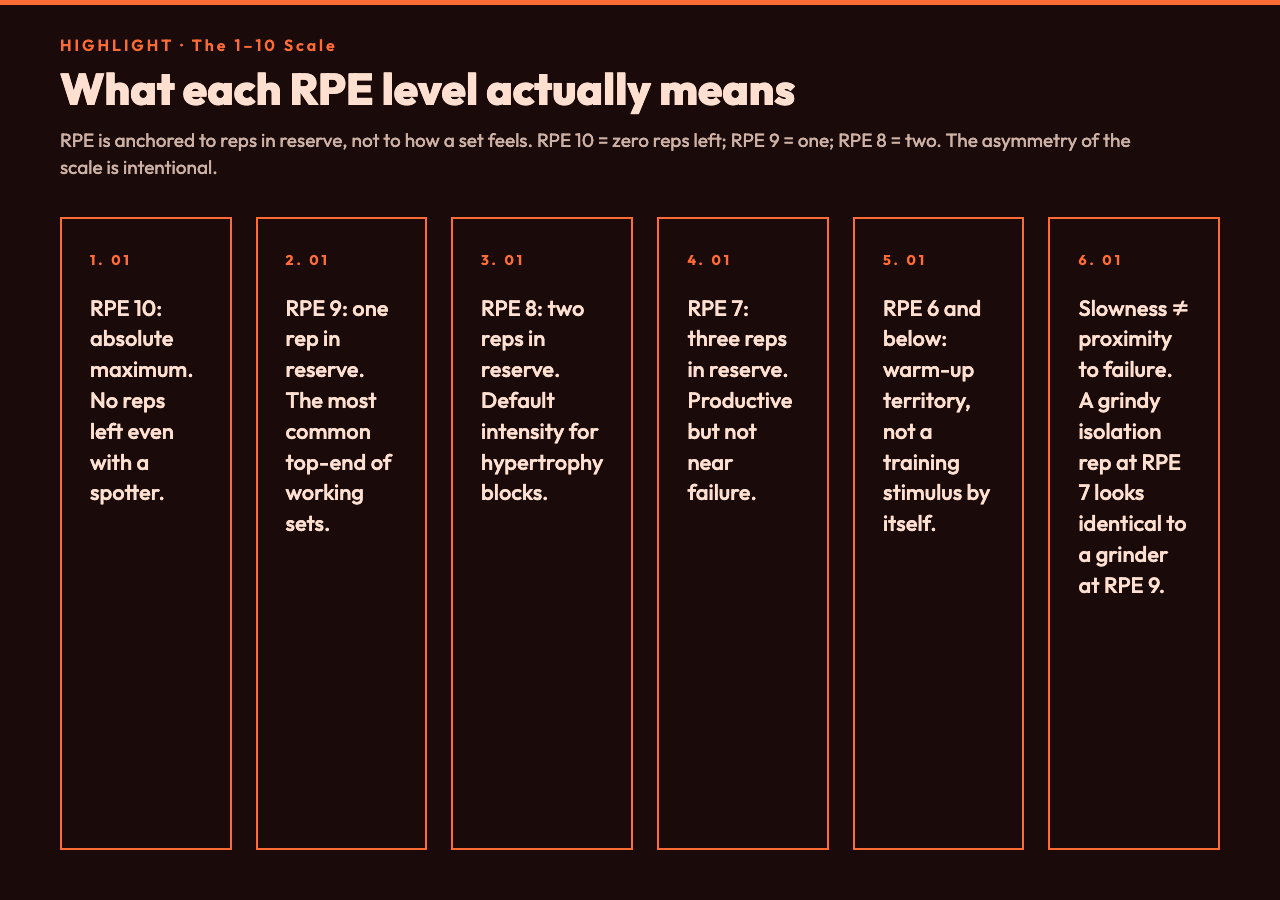
- RPE 10 — absolute maximum. No reps left. You will not get another one even with a spotter’s help. Lifters rarely train here deliberately except for top-end testing.
- RPE 9 — one rep in reserve. You could hit one more, but it would be ugly and slow. Most “hard” working sets end here.
- RPE 8 — two reps in reserve. The set felt tough, you grinded the last one, and you know you had two more clean reps available.
- RPE 7 — three reps in reserve. The set was productive but you weren’t anywhere near failure. This is the default intensity for most hypertrophy work.
- RPE 6 and below — warm-up territory. The set is a means to a primed nervous system, not a training stimulus by itself.
The scale is asymmetric on purpose. RPE 7 to 9 is where the productive work lives; RPE 5 is barely a stimulus and RPE 10 is a cost you pay deliberately, not by accident. A common mistake beginners make is logging every working set as “RPE 10” because the bar moved slowly — slowness is not the same as proximity to failure, especially on isolation movements where a grindy curl at RPE 7 looks identical to a grinder at RPE 9.
How RPE Translates to Percent of One-Rep Max
The Tuchscherer/RPE chart — the lookup table most coaches keep taped to a wall — pairs RPE with reps to give a percentage of your one-rep max (1RM). At RPE 10 (zero reps in reserve), 1 rep equals 100% of 1RM. At RPE 9, you can do 2 reps, so the working weight is roughly 95.5% of 1RM. At RPE 8, three reps, around 92.2%. The pattern continues: each half-point of RPE corresponds to roughly 2 to 3% of 1RM at low rep counts.
That relationship is the reason the One Rep Max Calculator at Elysia Tools and the RPE Calculator are complementary. If you know your 1RM to within a few percent — and most lifters know it to within 5% from a recent test or a calculated estimate — RPE lets you program training loads in real time without a recalculation cycle. A set prescribed as “3 reps at RPE 8” becomes “92% of 1RM for 3 reps” automatically, and if your last warm-up felt like RPE 6 instead of RPE 5, you adjust down without ceremony.
Where RPE Beats the Heart-Rate Monitor
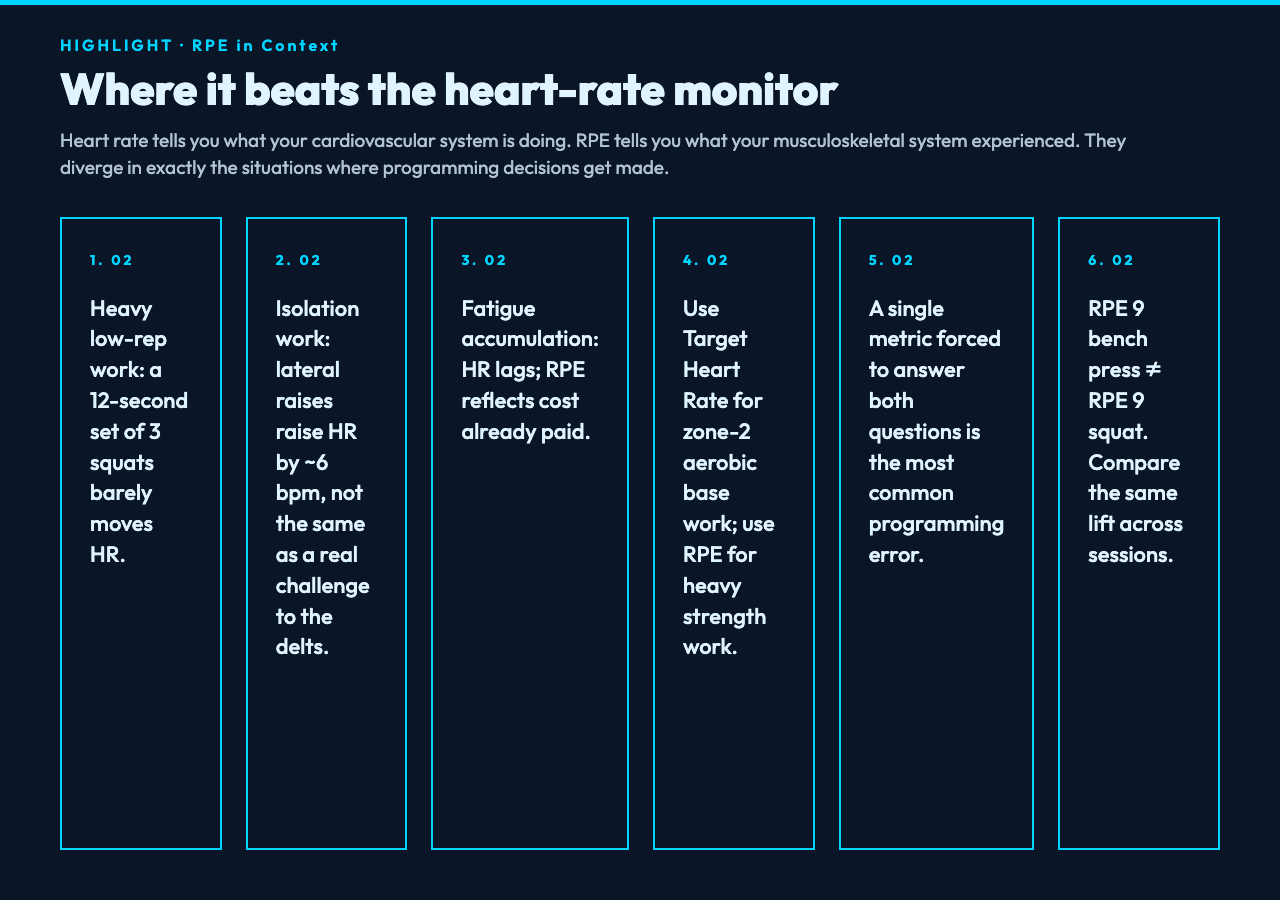
Heart rate tells you what your cardiovascular system is doing; RPE tells you what your musculoskeletal system experienced. The two diverge in exactly the situations where training decisions get made:
- Heavy low-rep work. A set of 3 squats at 85% of 1RM barely moves heart rate because the set lasts 12 seconds. RPE 9, however, captures the fact that you just produced near-maximal force.
- Isolation work. A set of 12 lateral raises raises your heart rate by 6 bpm, but RPE 9 means the delts were actually challenged. HR alone would label this as easy work.
- Fatigue accumulation. HR lags; RPE doesn’t. On the fourth work set of a squat session, an RPE of 9 reflects the fact that you’ve already accumulated fatigue that an earlier set didn’t cost you — your HR, which climbs slowly, doesn’t capture that.
The Target Heart Rate Calculator serves a different question: how hard should your aerobic base work be? Use it for zone 2 runs and steady-state cycling, where HR is the right axis. Use RPE for the heavy strength work where HR is essentially noise. Trying to force a single metric to answer both questions is the most common programming error in self-coached lifters.
RPE as Input to Training Stress Score
Training Stress Score (TSS) was designed for endurance athletes, but it can be back-fitted to strength work if you have a duration and an intensity. The simplest back-fit uses RPE as a proxy for intensity factor: a 45-minute zone-2 ride at RPE 4 is roughly TSS 50; the same duration at RPE 8 lands around TSS 90. This isn’t a calibrated substitute for power-meter TSS, but it is good enough to compare sessions across a training week and decide whether Tuesday’s heavy session left enough in the tank for Thursday’s tempo work.
The Training Stress Score Calculator at Elysia Tools accepts RPE inputs directly and converts them to a comparable load number, which is useful if you mix modalities. A typical week might look like: Monday heavy squat session TSS 110, Tuesday rest TSS 0, Wednesday 60-minute easy ride TSS 65, Thursday bench session TSS 70, Friday rest TSS 0, Saturday long run TSS 95. Total weekly TSS in the 340 range is consistent with productive training; weekly TSS above 500 sustained for more than two weeks is the territory where injury risk starts climbing.
Five Mistakes That Make RPE Numbers Lie
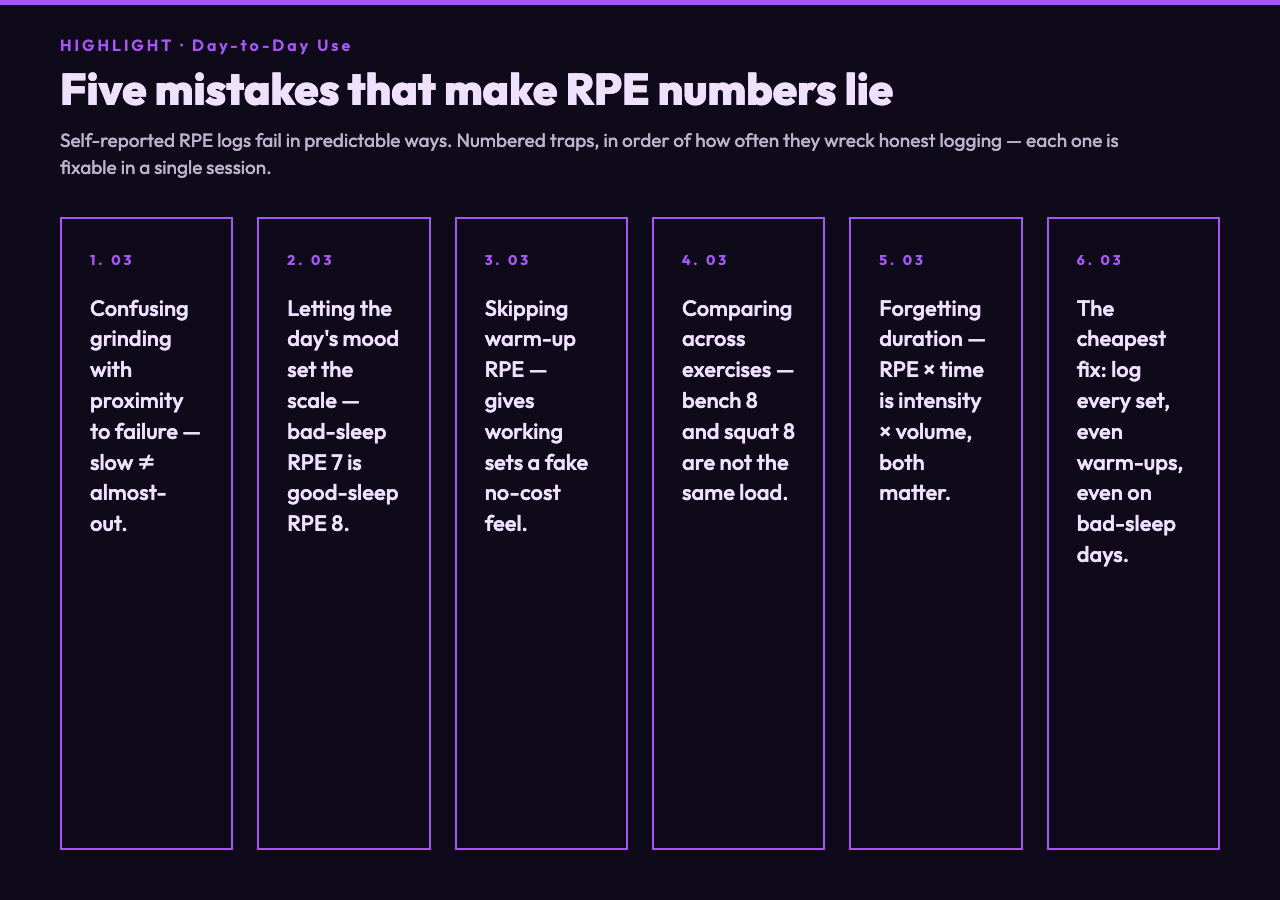
Numbered traps, in order of how often they wreck self-reported RPE logs:
- Confusing grinding with proximity to failure. A rep can be slow because the load is heavy relative to your strength, not because you’re near failure. The RPE number describes the second question, not the first.
- Letting the day’s mood set the scale. A bad-sleep RPE 7 might physiologically be the same as a good-sleep RPE 8. Logging the honest number each session reveals this pattern over weeks, but only if you log honestly.
- Skipping warm-up RPE. Warm-up sets should be logged too, even if just at RPE 4 to RPE 6. Skipping them gives the working sets a fake “no warm-up cost” feel.
- Comparing across exercises. An RPE 8 bench press and an RPE 8 squat are not the same physiological load — bench 8 is a much smaller systemic cost than squat 8. RPE is most reliable when comparing the same lift across sessions.
- Forgetting the duration. The RPE number alone is intensity; the duration is the second axis. A 20-minute easy jog at RPE 4 and a 90-minute easy jog at RPE 4 are not the same training load. The RPE Calculator at elysiatools.com/en/tools/rpe-calculator takes both inputs and returns a single comparable load estimate.
Putting It Together: A Week Logged Honestly
A practical week of honest logging might look like this. Monday: squats 5×3 at RPE 8 (last set RPE 9), bench press 4×6 at RPE 7. Tuesday: 45-minute easy ride at RPE 4, mobility work. Wednesday: deadlift 4×4 at RPE 8, pull-ups 3×8 at RPE 7. Thursday: 60-minute zone-2 run at RPE 5. Friday: overhead press 5×5 at RPE 7, accessory work logged but not graded. Saturday: long ride 90 minutes at RPE 5. Sunday: rest.
That week has two high-RPE sessions separated by 48 hours, an aerobic base component that doesn’t compete with the strength work, and an honest log of accessory work that doesn’t pretend to be heroic. Total weekly load is moderate; recovery is built in; the next week’s intensity can be calibrated from the data. Cross-reference the strength work with the Cycling Calorie Calculator or Running Calorie Calculator if you’re tracking energy expenditure against the strength load — aerobic work at RPE 5 produces a meaningful calorie cost that pure strength work doesn’t.
Tools scale up to honest logging the same way they scale up to anything else: by being used consistently, with the numbers they produce feeding the next decision. The RPE Calculator isn’t a substitute for a coach, but it makes the kind of data a coach would ask for — what was the actual intensity, how long did the work last, what was the total load — into something a self-coached lifter can produce in the same 30 seconds it takes to log the set. The cheapest intensity measurement in training is still the one you do by feel, and the cheapest way to make that measurement durable is to give it a number, write it down, and trust the trend over the single session.
Explore more tools for tracking intensity and load at elysiatools.com.