
Alveolar ventilation is the one respiratory number that decides hypercapnia versus alkalosis before the ABG comes back. Two patients on the same minute ventilation can sit on opposite sides of the PaCO2 curve because the tidal volume minus dead space term carries the entire signal. The Alveolar Ventilation Calculator turns VA = (VT − VD) × RR into a single number you can read at the bedside, with the Radford dead space estimate (~2 mL/kg ideal body weight) wired in as a fallback when no measured VD is available. Run it at Elysia Tools whenever you need a quick sanity check on whether the current ventilator settings or spontaneous breathing pattern are moving the right number in the right direction.
The three variables that actually drive VA
VA collapses four physiology concepts into one multiplication. Tidal volume (VT) is the volume that actually moves in and out of the mouth on each breath, normally 6–8 mL/kg ideal body weight in a healthy adult at rest. Respiratory rate (RR) multiplies that tidal volume into a per-minute flow. Alveolar dead space (VD) is the fraction of every breath that ventilates conducting airways and alveoli that are ventilated but not perfused — air that does not participate in gas exchange. Multiplying (VT − VD) by RR strips out the wasted fraction and leaves only the air that actually reaches the alveolar-capillary interface per minute.
The math hides one critical asymmetry. Cutting VT from 500 mL to 300 mL does not reduce VA linearly because (VT − VD) is the subtraction. If VD is 150 mL, the alveolar portion drops from 350 mL to 150 mL — a 57 percent cut in alveolar ventilation from a 40 percent cut in tidal volume. Rate compensation does not fully recover the loss because dead space is paid on every breath. This is why shallow tachypnea is the worst pattern: high minute ventilation, almost no alveolar ventilation, PaCO2 climbing on every arterial blood gas.
How the Radford dead space estimate works
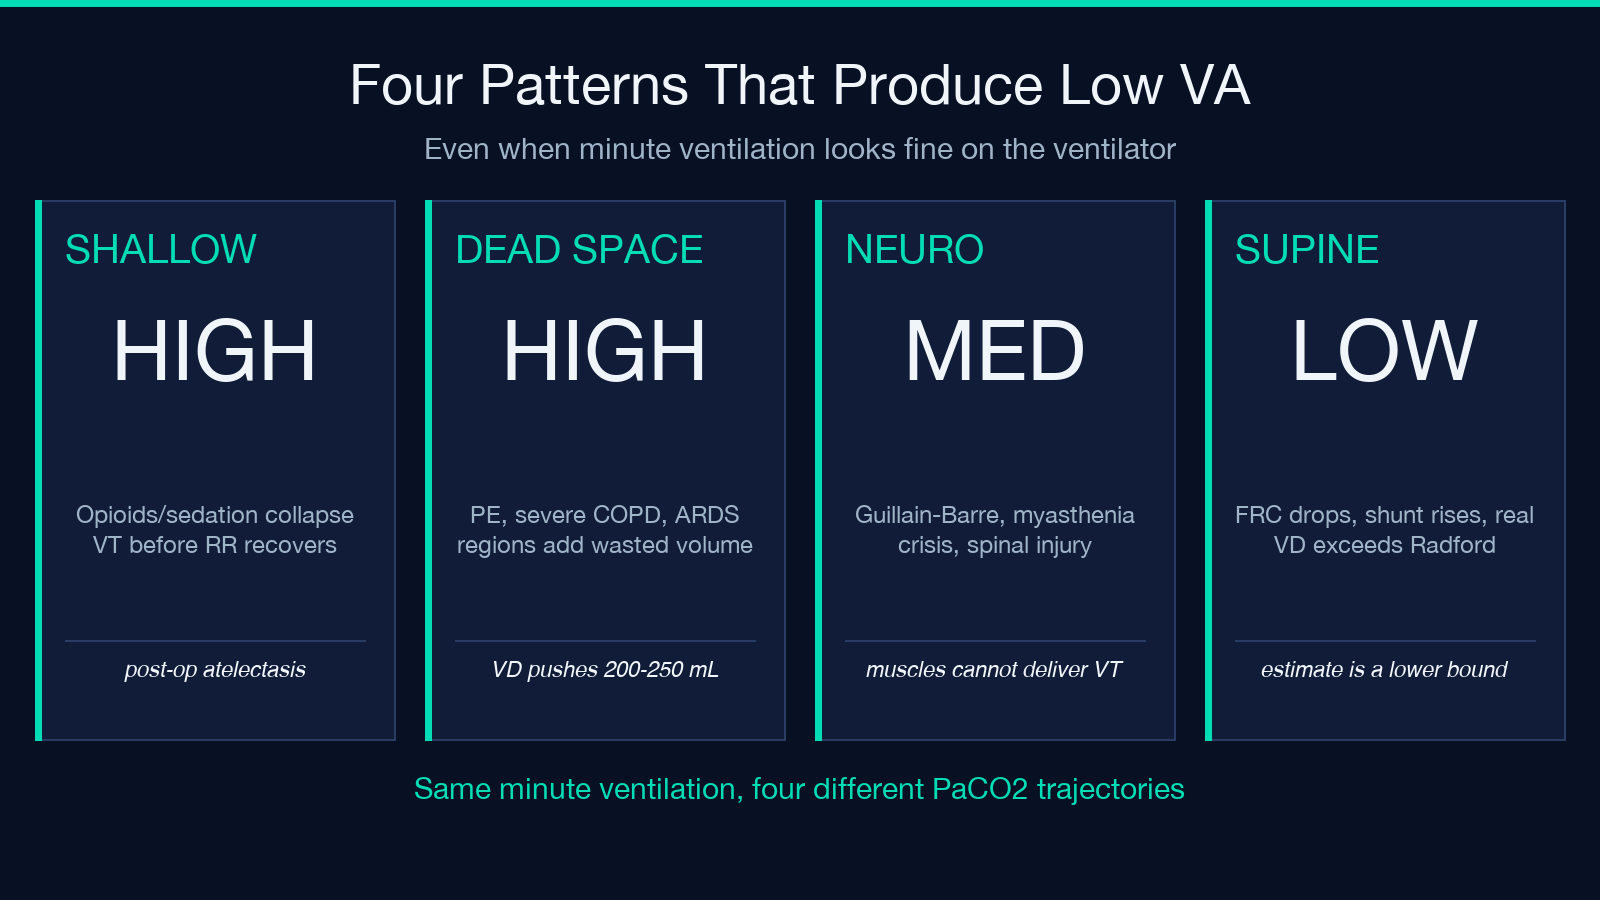
When you do not have a measured VD from volumetric capnography or a Bohr-Enghoff calculation, the calculator falls back to the Radford approximation: dead space ≈ 2 mL/kg of ideal body weight. For a 70 kg adult that gives 140 mL of dead space, which sits at the lower end of the textbook range of 120–200 mL and is conservative for healthy lungs. The estimate is derived from Radford’s 1955 NEJM paper and is reasonably accurate for normal subjects, but it underestimates dead space in disease states where alveoli are ventilated but not perfused — pulmonary embolism, severe COPD with emphysematous destruction, ARDS with collapsed but perfused regions, and the supine position can all push the real VD toward 200–250 mL.
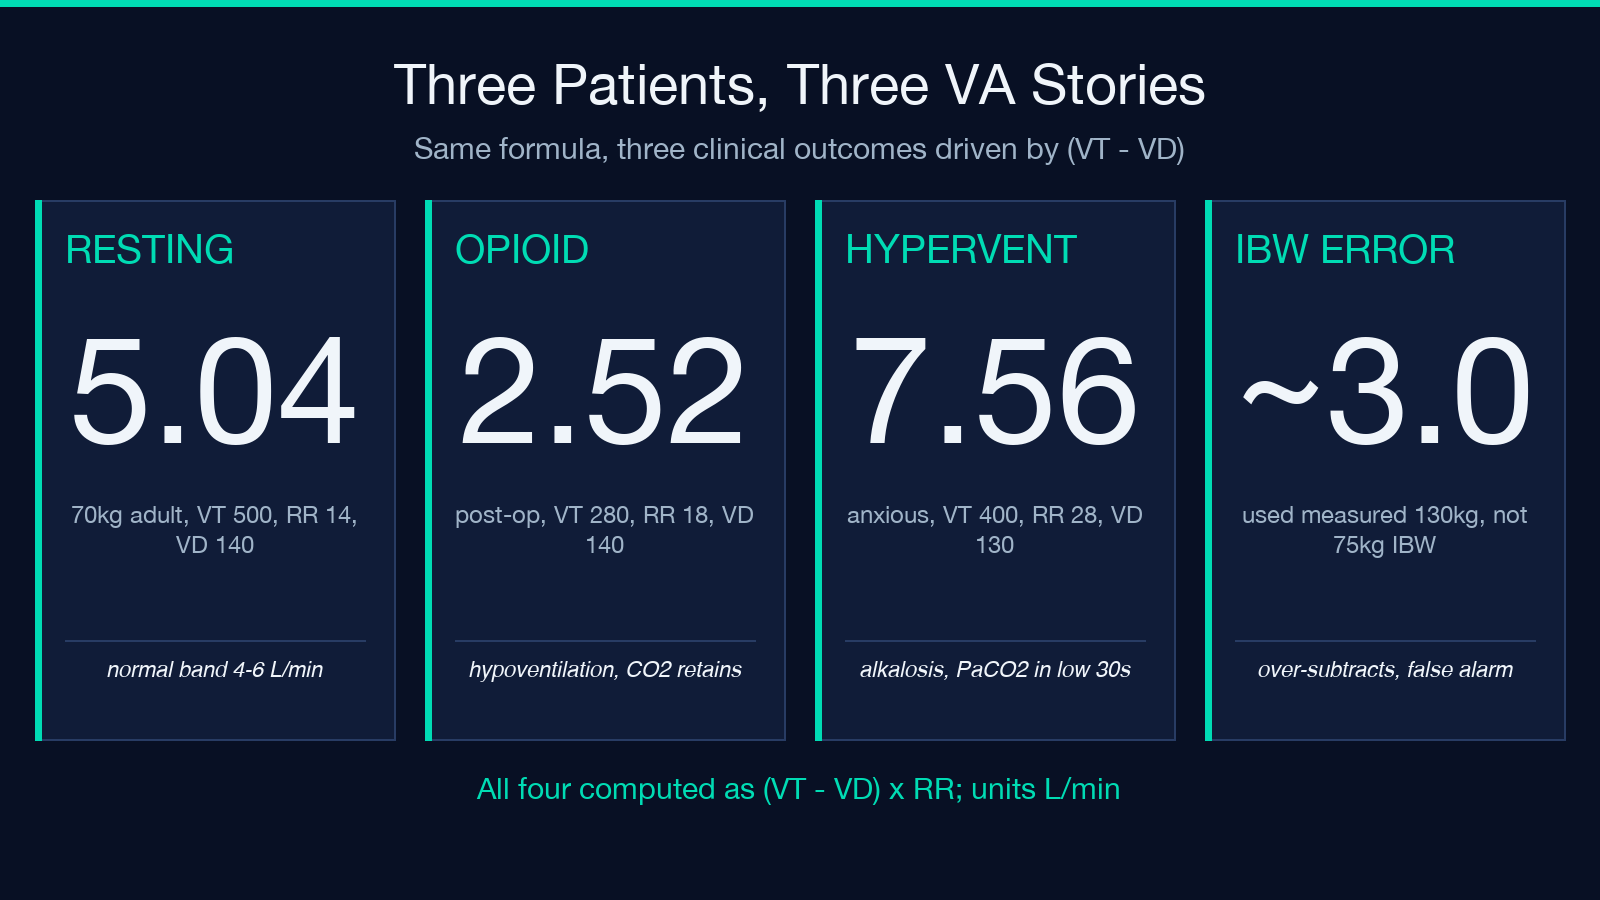
Ideal body weight, not actual body weight, is the right denominator here. The Radford formula assumes the dead space scales with lung size, which scales with height and sex, not adiposity. For a 1.80 m male, IBW ≈ 75 kg; for a 1.60 m female, IBW ≈ 52 kg. Plug actual body weight in for a 130 kg patient and you get a 260 mL dead space estimate that is wildly inflated — the calculator will then over-subtract, under-report VA, and look like the patient is hypoventilating when they are actually fine. Always use IBW for the dead space estimate.
Reading the result against the normal range
Normal resting VA in adults is ~4–6 L/min, with most healthy adults sitting between 4.5 and 5.5 L/min at a respiratory rate of 12–16 and tidal volumes around 500–600 mL. Numbers below 4 L/min flag hypoventilation, and the calculator makes the link to hypercapnia explicit in the result: low VA means CO2 accumulates, PaCO2 rises, pH drops, and you are looking at a respiratory acidosis. Numbers above 7 L/min flag hyperventilation, which drives PaCO2 down and produces respiratory alkalosis — common in pain, anxiety, sepsis, PE, and early salicylate toxicity.
The relationship between VA and PaCO2 is approximately inverse. Halve VA and PaCO2 roughly doubles, all else equal. This is why a patient whose minute ventilation looks reassuring on the ventilator (8 L/min) but whose tidal volumes are small (350 mL) and whose rate is high (22) can still be hypercapnic — their effective VA may be only 4 L/min, and the ABG will show a PaCO2 in the high 40s or low 50s. The minute ventilation number on the vent display is a trap. The alveolar ventilation number from the calculator is what tracks PaCO2.
Pattern recognition: which patient is at risk
Three bedside patterns reliably produce low VA even when the respiratory rate is normal or elevated. The first is shallow breathing from opioids, sedation, or post-operative atelectasis — VT drops while RR compensates only partially, and the (VT − VD) subtraction hits harder than the rate gain recovers. The second is increased dead space from PE or severe COPD — VD swells toward 200–250 mL, and even normal tidal volumes become inadequate. The third is neuromuscular weakness (Guillain-Barré, myasthenia crisis, high spinal cord injury) where VT drops because the muscles cannot deliver the volume, and the same shallow tachypnea trap applies.
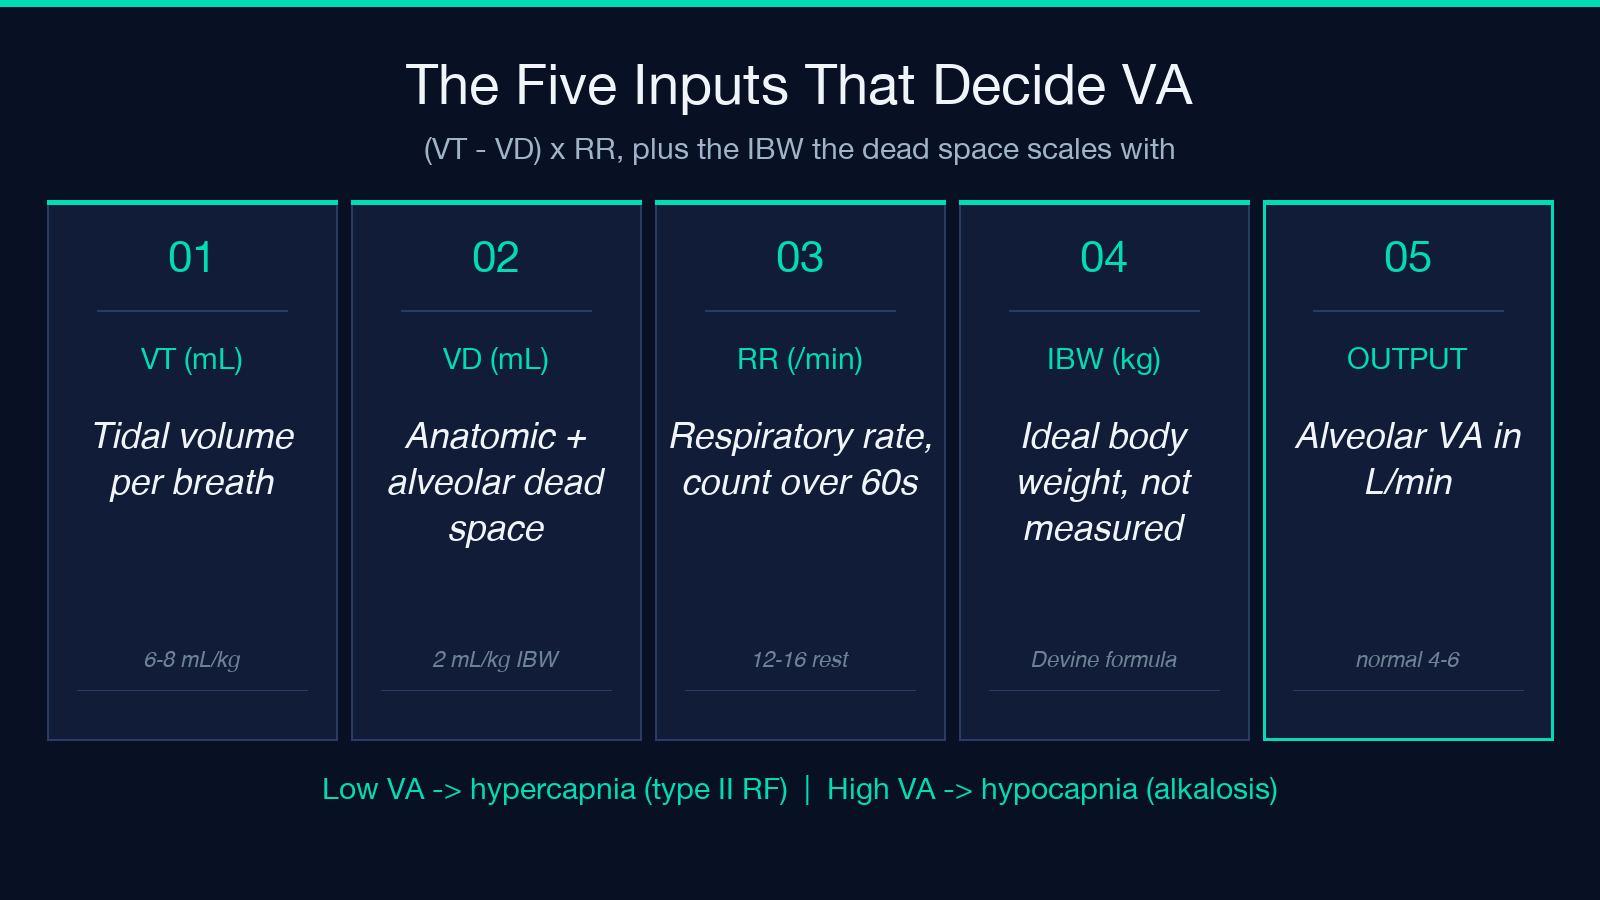
The calculator is most useful as a “what-if” tool during ventilator adjustment. Set the current VT, RR, and IBW, read VA, then move the variables one at a time and watch VA respond. Doubling RR from 12 to 24 roughly doubles VA (linear in rate). Raising VT from 400 to 600 mL adds 200 mL of alveolar volume per breath, multiplied by rate. The shape of the response curve is the educational point: rate scales linearly, tidal volume scales linearly minus a fixed dead space tax, and the combination produces the alveolar minute ventilation that the lungs actually use.
Common pitfalls when calculating by hand
The most frequent error is using minute ventilation (VE = VT × RR) as if it were alveolar ventilation. They are different numbers by exactly the dead space term. The second most frequent error is forgetting that the 2 mL/kg factor is for ideal body weight, not measured weight, which inflates the dead space estimate for obese patients. The third is reporting VA in mL/min when the literature uses L/min — divide by 1000 before comparing to the textbook 4–6 L/min range, or the result looks 1000 times worse than it is. The fourth is mixing up alveolar ventilation with alveolar gas flow, which on a single breath is a different concept entirely (it is the instantaneous flow, not the per-minute volume).
A subtler pitfall is ignoring the patient’s position. Supine position reduces functional residual capacity and can increase the proportion of alveoli that are perfused but not ventilated (shunt), which behaves like added dead space in terms of PaCO2 response. The Radford estimate assumes upright healthy lungs; for a supine ICU patient the real VD is usually higher than the calculator returns. Treat the result as a lower bound in that context, and if the ABG says hypercapnia but the calculator says normal VA, believe the ABG and look for increased dead space pathology.
When to trust the number and when to question it
Trust the calculator when the patient has healthy lungs, is breathing spontaneously, has a measured or estimable IBW, and the inputs are within the textbook ranges (VT 400–800 mL, RR 8–25, IBW 50–90 kg). Question the number when the patient is on mechanical ventilation with PEEP above 10 cmH2O, has known PE or severe emphysema, is morbidly obese where the IBW estimate may itself be off, or has rapidly changing respiratory mechanics. In those cases the Radford fallback is a guess, and a measured VD from volumetric capnography is the right next step.
The calculator also assumes steady state — a single snapshot of VT, RR, and weight gives one VA, but over the next 10 minutes the patient may shift their pattern and the number drifts. Read it as a snapshot, not a trend. For a trended picture, run the calculation against averaged values from the ventilator or the nursing flow sheet over the last hour, and pair it with end-tidal CO2 or ABG PaCO2 to confirm the CO2 number is actually responding to the VA change. The calculator gives you the alveolar side; the gas monitor gives you the consequence. Pair them.
Putting it together at the bedside
Start with IBW, not measured weight. Pick VT from the ventilator or estimate it from the spirometry trace. Use RR over a full minute if the patient is spontaneous, or read it from the vent. Compute VA = (VT − VD) × RR with VD = 2 mL/kg IBW as the fallback. Compare to the 4–6 L/min normal range. If VA is below 4 L/min, look for hypoventilation, hypercapnia risk, and the clinical drivers (shallow breathing, increased dead space, neuromuscular weakness). If VA is above 7 L/min, look for hyperventilation, hypocapnia risk, and the clinical drivers (pain, anxiety, PE, sepsis, salicylates).
Worked examples across three clinical scenarios
A 70 kg healthy adult at rest with VT = 500 mL, RR = 14, and VD = 140 mL (2 mL/kg IBW) sits at VA = (500 − 140) × 14 = 5040 mL/min, comfortably in the 4–6 L/min normal band. A post-operative opioid-loaded patient with VT collapsed to 280 mL, RR climbing to 18 in compensation, and VD still 140 mL has VA = (280 − 140) × 18 = 2520 mL/min — a textbook hypoventilation number, the patient is retaining CO2, and the ABG will show a PaCO2 in the high 50s or 60s. A anxious young woman hyperventilating at VT = 400 mL, RR = 28, with normal VD = 130 mL has VA = (400 − 130) × 28 = 7560 mL/min, the upper end of hyperventilation, and her PaCO2 will sit in the low 30s with a respiratory alkalosis on the gas panel. Same formula, three different clinical stories, all driven by the (VT − VD) × RR shape.
For more on the underlying physiology and a quick interactive version with the Radford estimate wired in, see the Alveolar Ventilation Calculator. For related respiratory and gas exchange calculations, browse the rest of the Health category on elysiatools.com. The calculator is a teaching tool, not a clinical decision support system — it gives you the math, you provide the clinical judgment.
