
A kanban board is not a delivery metric. It is a queue with a calendar. The team looking at a board of red dots and blue dots and asking “are we shipping faster?” is asking the wrong question — the right question is “what does the cumulative flow diagram say about where work is piling up, and what does Little’s Law tell us is about to break?” The Kanban Cycle Time & Throughput Coach reads a Jira-style CSV of created, started, and resolved timestamps the way an agile coach reads one — by extracting percentiles, computing throughput, drawing the CFD, and surfacing the four reading rules that catch the cases where “we shipped 12 stories” is actually masking a stalled flow. This field guide walks through the import format, the percentile math, the CFD reading rules, the Little’s Law consistency check, and the three diagnostic patterns that turn a board snapshot into a coaching conversation.
What “Cycle Time” Actually Means and Why the Board Lies
Cycle time is the elapsed time from when work started (entered “in progress”) to when work resolved (entered “done”). Lead time is the elapsed time from when work was created (entered the backlog) to when it resolved. The two numbers are not interchangeable: cycle time measures how fast the team works once it picks something up; lead time measures how fast the customer sees a result from the moment they asked. Most kanban reporting conflates them and produces numbers that look good but mean nothing — a team can drop their reported “cycle time” by waiting two weeks before starting tickets, because the metric measures from start, not from request.
Three operational consequences follow. First, the CSV must include all three timestamps (created, started, resolved) for the metric to be meaningful — a board with only created and resolved produces only lead time, and the cycle-time percentile analysis collapses. Second, the resolution event has to be defined explicitly: in Jira this is usually the transition into a “Done” or “Closed” status, but some teams have intermediate “Resolved” states that should not count as a true finish. Third, work that was started but never resolved is WIP, not a cycle-time sample — including it skews the percentile downward because the in-progress stories sit in the dataset as long-tailed outliers rather than being filtered out as live work.
The Cycle Time Coach accepts the canonical Jira CSV export shape (Issue key, Issue type, Status, Created, In Progress, Resolved, plus optional Cycle time and Lead time columns if Jira has computed them server-side) and a simpler three-column shape (Issue, created, resolved) for teams not on Jira. The latter is lead-time-only; the tool flags this in the output and disables the cycle-time percentiles rather than computing them on incomplete data.
The Percentile Stack: 50, 85, 95
A mean cycle time is almost always wrong. Distribution is everything in queue theory — a team with a mean of 5 days and a tight distribution (everything done in 4–6 days) is healthy; a team with the same mean but a long-tailed distribution (most things done in 3 days, some in 30) is in trouble and the trouble is invisible in the mean. This is why cycle-time reporting uses percentiles: the 50th (median) is the typical case, the 85th is the realistic case-management forecast (most customer commitments should be honored if you commit at the 85th percentile or lower), and the 95th is the worst-reasonable-case that catches the tail.
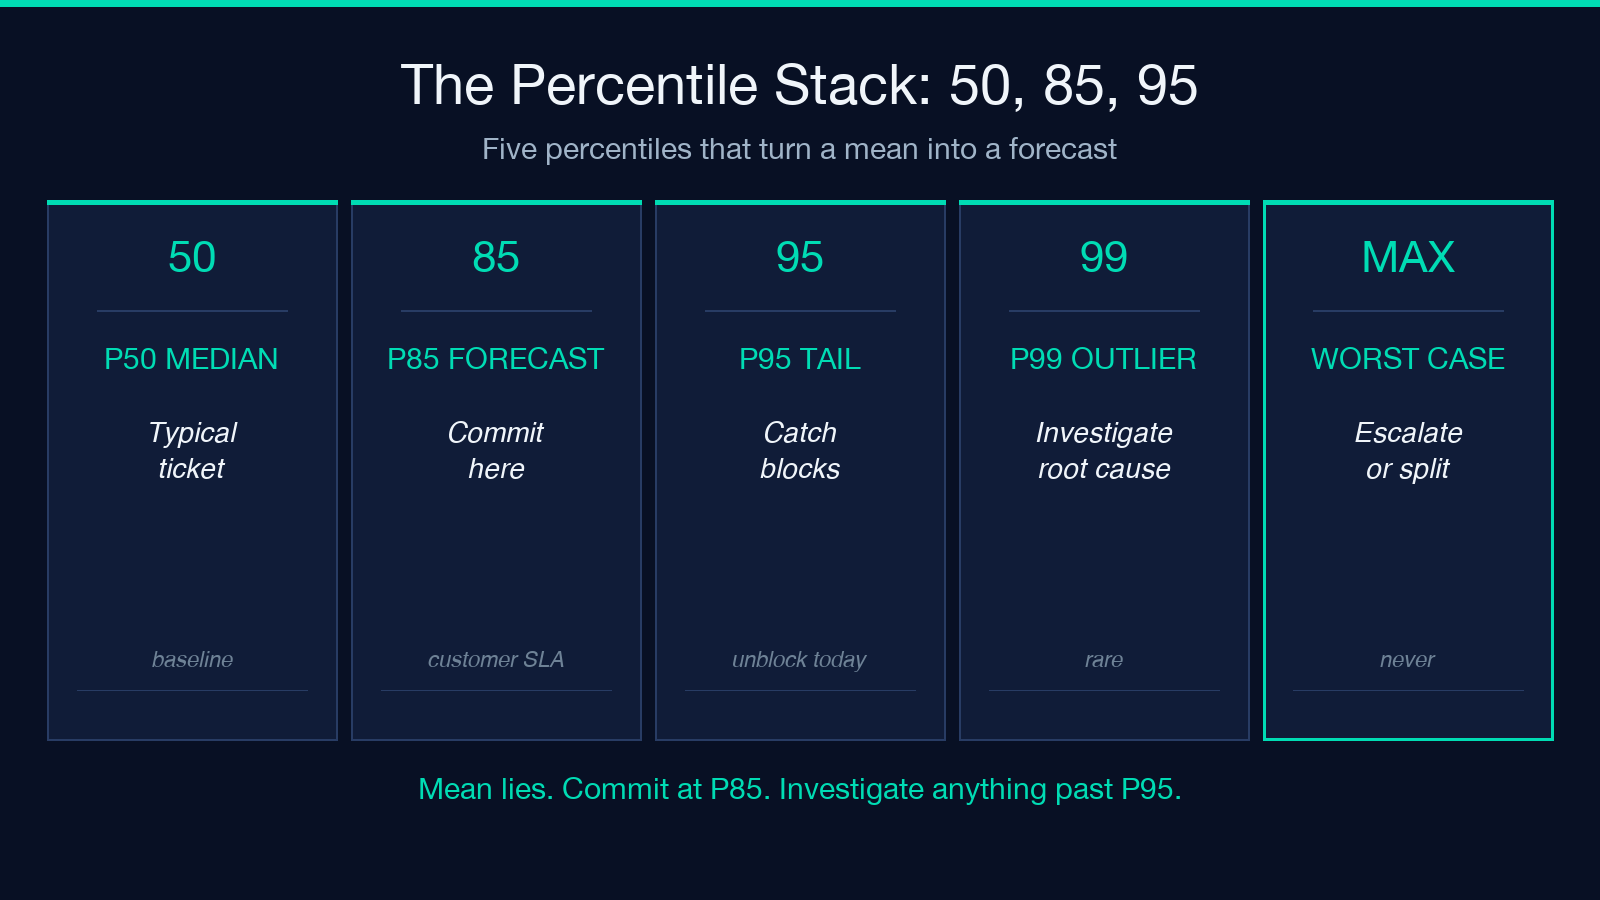
The reading rule the Cycle Time Coach applies: if the 85th percentile is more than 2.5x the median, the distribution is bimodal and there is a separate long-tail problem that the mean hides. If the 95th percentile is more than 4x the median, there is a starvation or blocking pattern — some tickets are sitting blocked for days or weeks and the team’s working cycle is being polluted by dependency stalls. A useful operational heuristic: forecast delivery dates at the 85th percentile (most customer commitments should be safe); use the 95th to identify the tickets that need help or de-scoping.
A second reading rule applies when the 50th percentile is itself high (more than the team’s iteration length). If the median cycle time is 14 days and the team operates on 2-week iterations, half the tickets take the full iteration or longer — there is no slack for incidents, dependency stalls, or the unplanned work that always shows up. The board is at saturation.
WIP Age and the Stuck-Ticket Alert
WIP age is the elapsed time since the current in-progress work entered the in-progress state. It is not the same as cycle time (which only applies to completed work) and it is not the same as lead time (which applies to resolved work). WIP age is the live equivalent: how old is the work sitting on the board right now?
The reading rule the Cycle Time Coach surfaces: any in-progress ticket whose age exceeds the 85th-percentile historical cycle time is stuck. A 30-day-old in-progress ticket on a team whose 85th percentile cycle time is 9 days is not “still in progress” — it is stuck, and the cost of leaving it on the board is the implicit message that the team tolerates 30-day tickets, which pulls the distribution right and inflates every future percentile. The tool flags every WIP item past the 85th-percentile threshold in the output and recommends either splitting, de-scoping, or explicit re-prioritization.
A second use of WIP age is the WIP-age distribution itself. Healthy teams have a tight WIP-age distribution (most in-progress items are days old, not weeks); teams in trouble have a long WIP-age tail that mirrors the long cycle-time tail. The two metrics measure different things but tell the same story.
Throughput: Per Day, Per Week, Per Month
Throughput is items resolved per unit time — count, not duration. The metric sounds simple and it is, but the reporting window matters. Daily throughput is volatile and small samples make the percentage error large (3 stories on a Tuesday and 0 on a Wednesday is a 100% drop that means nothing). Weekly throughput is the standard reporting window for most kanban teams and the Cycle Time Coach defaults to it. Monthly throughput is useful for trend lines and capacity conversations but loses the weekly signal.
The reading rule: weekly throughput variance greater than 40% (i.e. some weeks ship 8 stories and others ship 12) is a flow-stability problem. Throughput is supposed to be approximately constant when WIP is constant — that is the operational consequence of Little’s Law. Large week-to-week variance with stable WIP means the team is being interrupted (incidents, dependencies, unplanned work) or the work-item sizes are bimodal (some 1-day tasks mixed with 5-day tasks with no intermediate).
Throughput per month is the metric to use for stakeholder reporting. A team that ships 40 stories per month with a stable 1.5 throughput/day average has a predictable delivery rate; that number is the basis for forecasting, capacity conversations, and the answer to “how long will the backlog take?” — the forecast is backlog_size / monthly_throughput, with the appropriate confidence interval from the cycle-time distribution layered on top.
The CFD Reading Rules
The cumulative flow diagram plots the cumulative count of items in each kanban state (To Do, In Progress, Done, etc.) over time. The chart looks deceptively simple — three or four monotonically increasing lines — but four reading rules catch the patterns that change management.
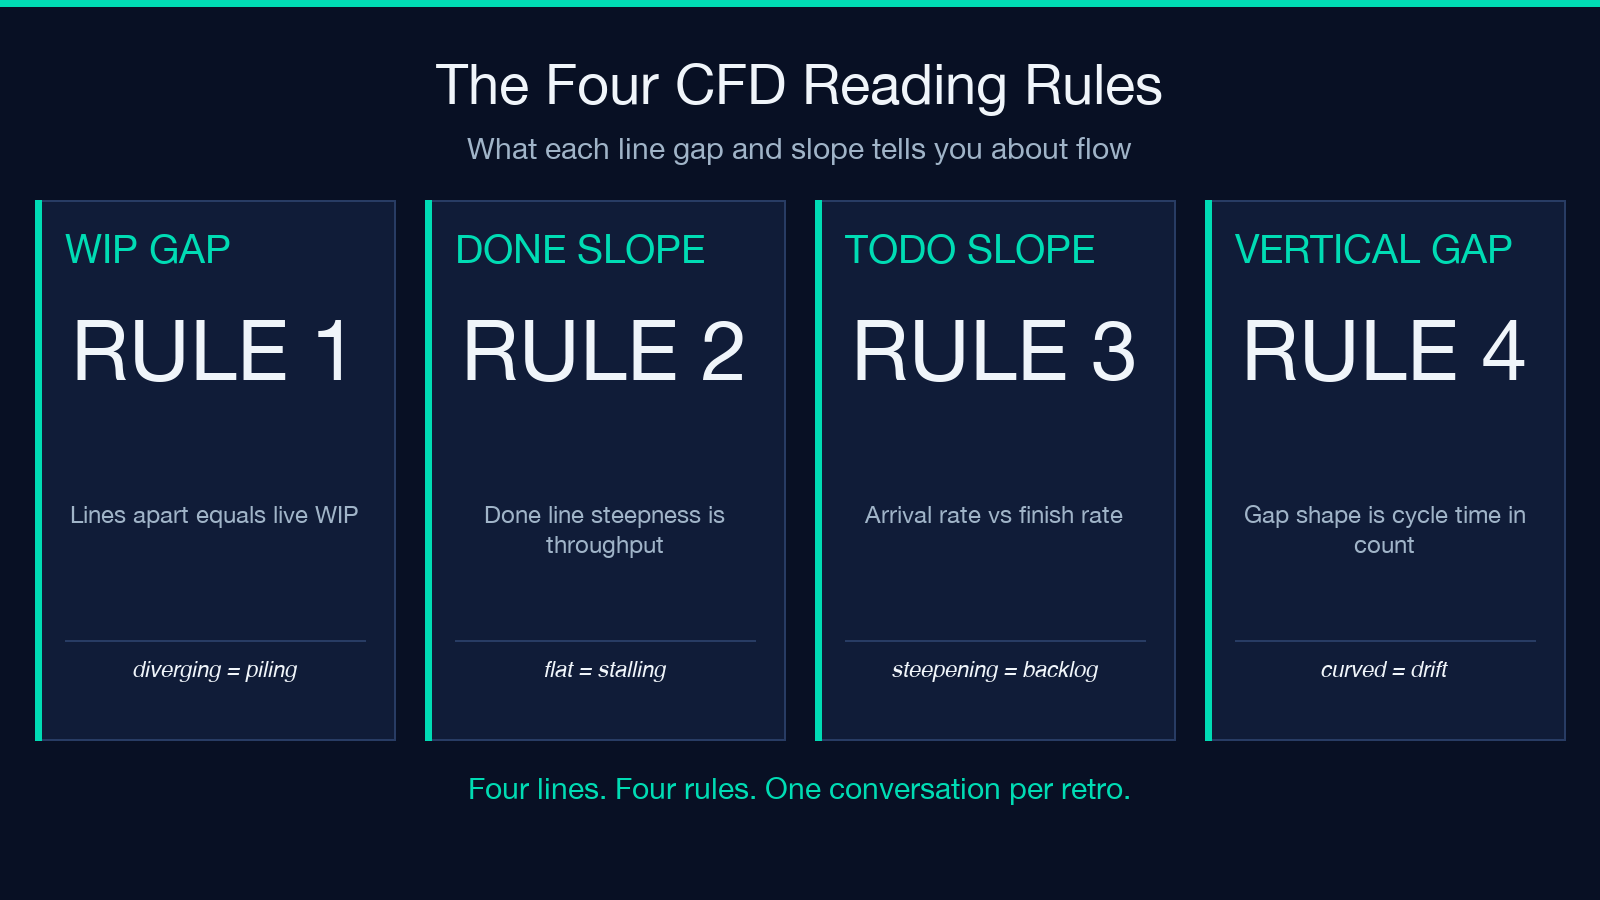
Rule 1: the gap between two lines is the WIP in the band they represent. If the In Progress line and the Done line are diverging, WIP in the In Progress band is growing. If they are parallel, WIP is stable. If they are converging, WIP is shrinking. This is the live WIP reading from the CFD.
Rule 2: the slope of the Done line is throughput. A steeper Done-line means higher throughput. A flatter Done-line means lower throughput. Slope changes from one week to the next are the visual signature of throughput variance.
Rule 3: the slope of the To Do line is arrival rate. If the To Do line is steepening, more work is entering the backlog than the team is finishing. The gap between To Do and Done grows over time, which is the visual signature of an unmanaged backlog.
Rule 4: the vertical gap between the To Do line and the Done line at any moment is the cycle time converted to count. The shape of the gap (whether it is straight or curved) tells you whether cycle time is stable or drifting.
The Cycle Time Coach renders the CFD with these rules annotated and flags each one when the visual reading detects a problem: diverging WIP, flattening throughput, steepening arrival, or drifting cycle time. The annotated CFD is the single best conversation-starter for a team retro — the visual makes the problem obvious in a way that tables of numbers do not.
Little’s Law Consistency Check
Little’s Law states that WIP = throughput × cycle_time. The relationship holds for any stable queue. The consistency check the Cycle Time Coach performs: compute the implied WIP from the throughput and cycle-time percentiles, compare it to the actual average WIP over the reporting window, and flag any discrepancy larger than 25%.
A discrepancy means one of three things. Either the throughput is being measured wrong (resolved items being double-counted, or unresolved items being included), or the cycle time is being measured wrong (clock not stopping on blocked items, or work that was started but never marked done is distorting the average), or the queue is not in steady state (WIP is changing fast enough that Little’s Law’s stability assumption is violated). In practice the discrepancy usually points to a measurement problem, not a flow problem — and discovering it surfaces a metric-hygiene issue that needs to be fixed before any flow improvement work is done.
The Little’s Law check is also the diagnostic for the most common team self-deception: “we have high throughput AND low cycle time, we are doing great.” If those two numbers are inconsistent with the actual WIP on the board, the team is misreading its own metrics. The tool’s check catches this directly.
The Three Diagnostic Patterns
Three patterns show up repeatedly in kanban data and each one calls for a different intervention. The Cycle Time Coach labels them so the team has a vocabulary for the conversation.
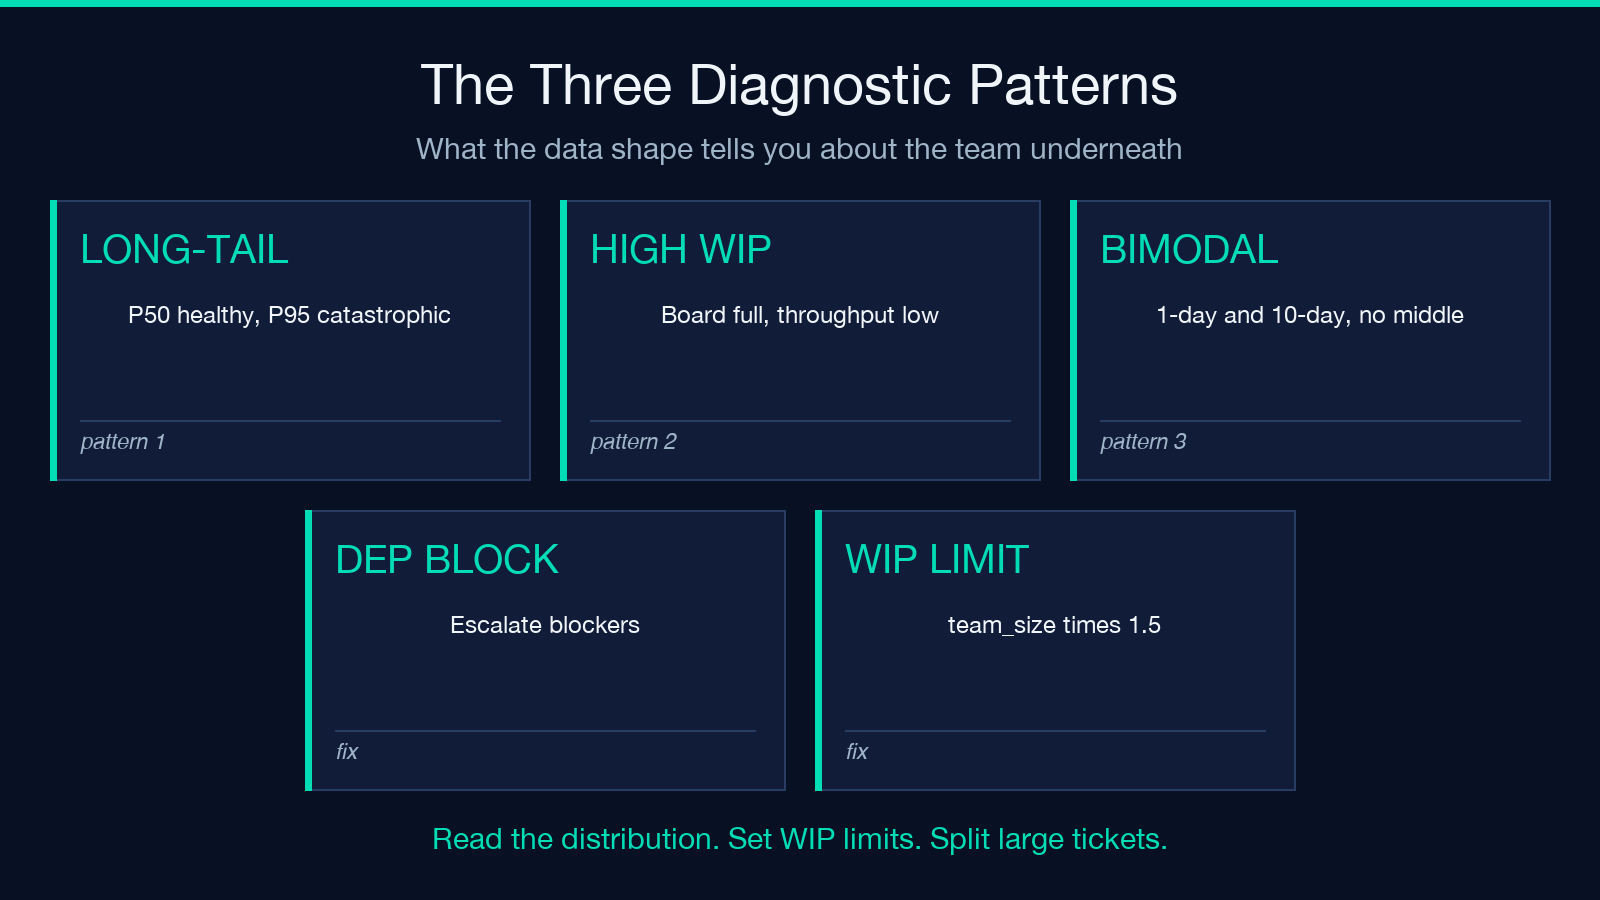
Pattern 1: Long-tail cycle time with normal median. The 50th percentile is healthy (5 days), the 85th is borderline (12 days), the 95th is catastrophic (45 days). The team is delivering most things at a normal pace but a small fraction of tickets are dragging for weeks. The cause is almost always dependencies — a ticket is “in progress” but actually blocked on another team, and the cycle-time clock keeps running while no work happens. The intervention is dependency mapping: identify which tickets are blocked, escalate the blockers, and consider splitting or de-scoping the dependent work.
Pattern 2: High WIP with low throughput. The board has 25 in-progress items and the team is finishing 5 per week. The cause is work-in-progress limits not being enforced, or the team has no WIP limit at all. The intervention is explicit WIP limits per column, with the Cycle Time Coach suggesting a starting limit based on Little’s Law: WIP_limit = team_size × 1.5. When the WIP exceeds the limit, the team stops starting new work and finishes what is in progress.
Pattern 3: Bimodal cycle time with bimodal work size. Tickets come in two size buckets — 1-day and 10-day — with nothing in between. The median cycle time hides the bimodality. The cause is missing story-splitting discipline: large items are not being decomposed before they enter the sprint. The intervention is story-splitting coaching, with the explicit goal of having 90% of items in the small bucket.
How to Use the Tool in a 60-Second Read
The Cycle Time Coach is built to compress the metric analysis above into a single import-and-read flow. Paste the CSV (Jira-style or three-column simple), and the tool returns the percentile stack, the throughput per day/week/month, the CFD with the four reading rules annotated, the WIP-age flagged list, the Little’s Law consistency check, and the diagnostic pattern label if one applies. For coaches, the tool is the data backbone of a flow retrospective. For engineering managers, it is the weekly health check. For Scrum Masters converting teams from sprint-driven to flow-driven, it is the metric set that justifies the transition with hard numbers rather than intuition.
The single most important habit the tool reinforces: read the distribution, not the average. A mean cycle time of 7 days is not a forecast, a target, or a commitment — it is a midpoint of a distribution that probably has a long tail. The forecast is the 85th percentile. The target is the 85th percentile shrinking over time. The commitment to a customer is the 85th percentile with an explicit confidence band.
Explore more flow and metrics tools at elysiatools.com.
