
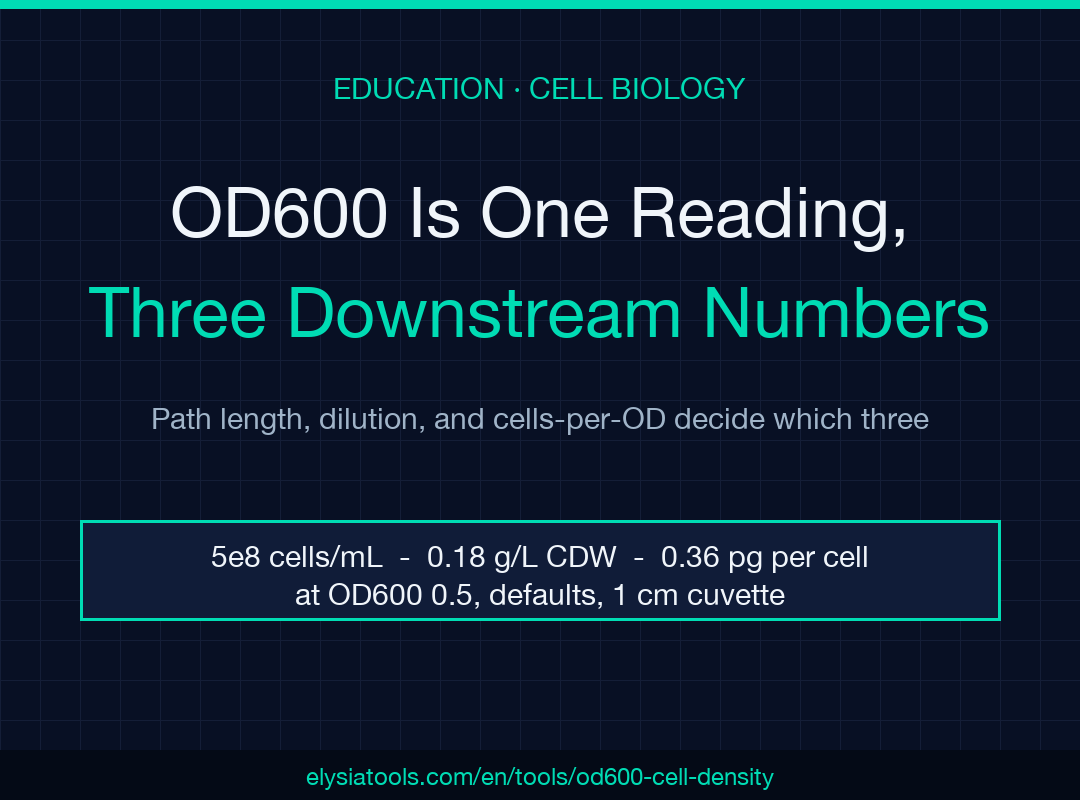
OD600 is one number that quietly turns into three downstream numbers, and the path length plus the cells-per-OD factor decide whether all three are right. Most bench spectrophotometers print OD600 to two decimals; almost none of them tell you the path length of the cuvette, and almost every published conversion factor for E. coli was measured on a different instrument with a different strain in a different medium. The calculator at Elysia Tools takes the reading you have, normalizes it to a 1 cm path, applies the dilution factor you actually used, and reports cells/mL, cell dry weight in g/L, and (when you give it a culture volume) the total cells and grams of biomass in the flask. Both conversion factors are editable because they are strain-, medium-, and instrument-dependent, and readings above OD 1 — beyond the linear range — are flagged for dilution. This field guide walks through the eight decisions that determine whether the number on the screen matches what is actually in the tube.
How to read OD600 without falling into the linear-range trap
The Beer–Lambert relationship between turbidity and cell density is linear only up to roughly OD600 0.3–0.5 in a standard 1 cm cuvette. Past that point the scattered light from one cell is re-scattered by the next, and the spectrophotometer under-reports the true absorbance. Most lab protocols dilute to OD600 0.1–0.3 and back-calculate, which is the workflow the calculator encodes by always multiplying by the dilution factor you specify. If you put the raw reading into the field without diluting, you will get a number — but the number will be wrong in a direction that scales with how far past 0.3 you went. The flagged-above-1 warning is the calculator’s way of saying “dilute this and run it again.”
The two conversion factors you must edit before you trust any answer
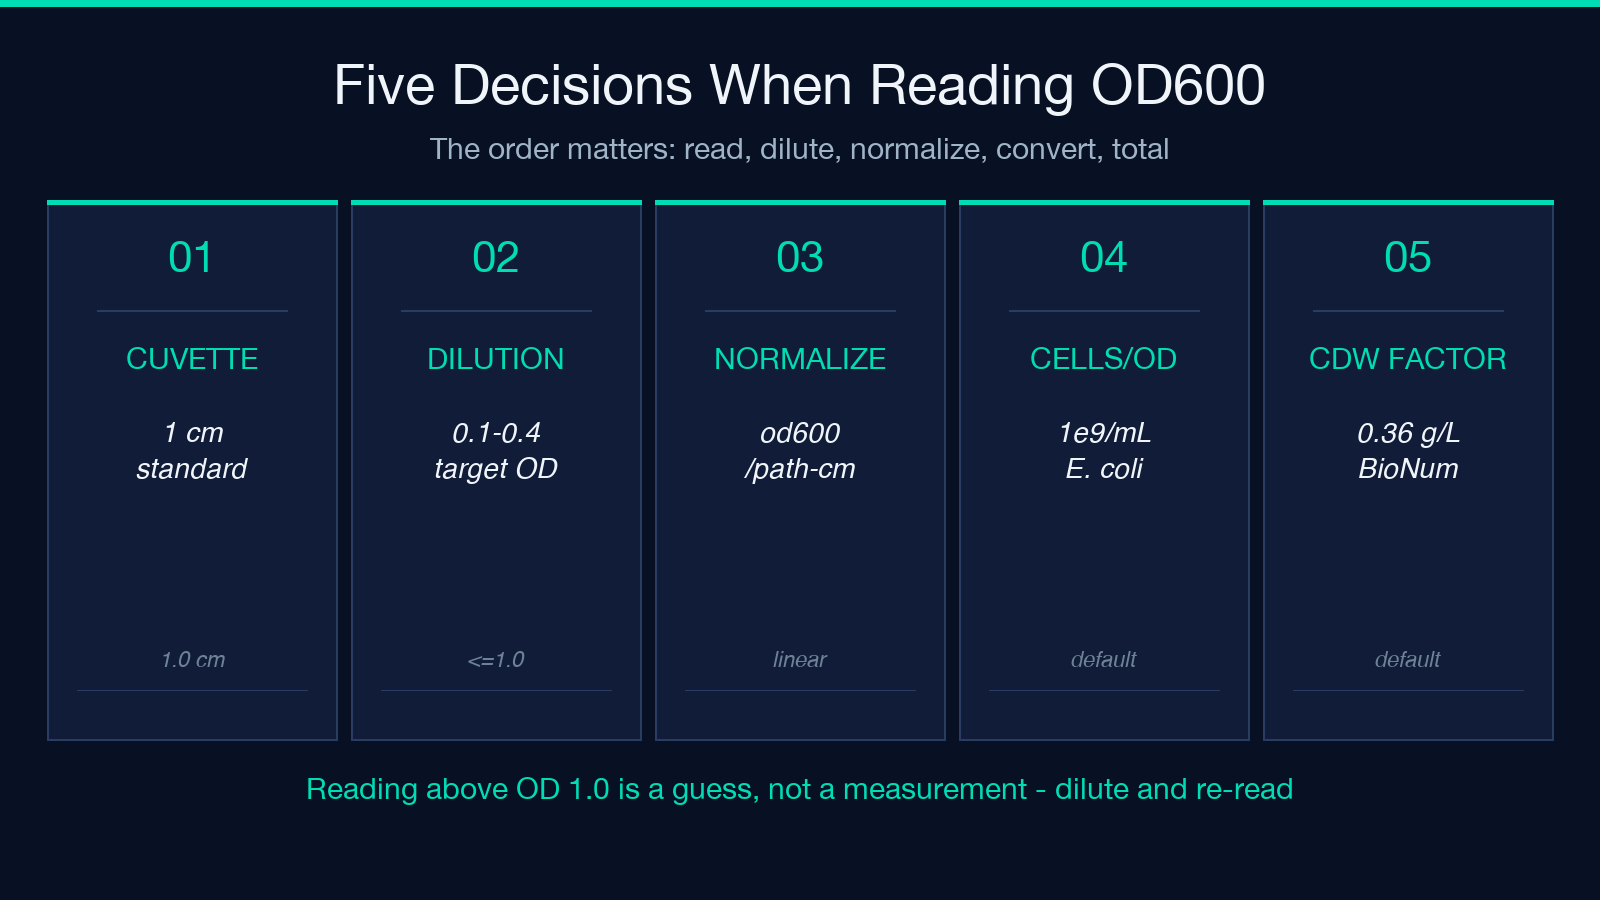
The defaults shipped with the tool are 1 × 10⁹ cells per OD600 unit per mL and 0.36 g/L cell dry weight per OD600 unit, both anchored to mid-log E. coli on LB at 600 nm in a 1 cm cuvette (BioNumbers 109837). Those values are reasonable starting points, not universal constants. A K-12 strain in M9 minimal medium with glucose typically runs 0.30–0.33 g/L per OD; a B. subtilis culture in the same medium can run 0.45 g/L per OD. Yeast at OD600 is almost always off — the right factor for S. cerevisiae is closer to 3 × 10⁷ cells/mL per OD600 unit, and the dry-weight conversion is closer to 0.20 g/L per OD. Editing the two fields to match your strain and medium is the difference between a literature-grade number and a teaching-grade number. The tool labels both fields as editable for exactly this reason.
From a single reading to total cells in the flask
The most common mistake on a Tuesday morning is treating the spectrophotometer reading as if it were the answer. The reading is one cell-density measurement at one moment in one cuvette. The downstream question is almost always larger: how many cells do I have in the 25 mL flask, or in the 250 mL seed culture, or in the overnight before I dilute it 1:100 into the expression culture. The calculator’s cultureVolumeMl field carries out that multiplication for you, and the JSON it returns includes both cellsPerMl and totalCells so you can cross-check the unit arithmetic before you trust either. For an undiluted mid-log E. coli culture at OD600 0.5 in a 1 cm cuvette, the math is 0.5 × 1 × 10⁹ = 5 × 10⁸ cells/mL, and the 25 mL flask holds 1.25 × 10¹⁰ cells. If your number is off by 10× at this step, the bug is almost always the dilution factor.
Why path length matters even when the spectrophotometer says 1 cm
A standard 10 mm cuvette is 1.0 cm of path length — except when the spectrophotometer is a NanoDrop or a Take3 plate reader, both of which use much shorter path lengths (often 0.5 mm or 1 mm) and depend on the liquid column height. A reading of OD600 0.5 on a NanoDrop is not the same as OD600 0.5 in a cuvette, because the light traveled through ten times less sample. The calculator’s pathLengthCm field is what normalizes the two readings back to a single comparable number. The default is 1 cm. For a 1 mm path length, divide the displayed value by 10; for a 0.5 mm path length, divide by 20. Most published conversion factors are quoted at 1 cm, so this normalization is what makes the cells-per-OD default meaningful when your instrument is not a cuvette spectrophotometer.
When OD600 reads above 1.0 — and what the dilution actually saves
Readings above OD600 1.0 are not measurements, they are guesses. The Beer–Lambert curve has already saturated, and the spectrophotometer is reporting a number that depends more on the instrument’s detector linearity than on the cell density. The correct response is to dilute into the 0.1–0.4 range, re-read, and let the calculator multiply back. The flag above OD 1 is not a warning to be ignored; it is the calculator telling you the output you are about to read is below the accuracy floor of the method. Dilutions of 1:5, 1:10, and 1:20 cover almost every late-log and stationary-phase case; the dilution factor field accepts integers and decimal fractions, so 0.1 is a valid 1:10 dilution.
Cell dry weight: the second number your downstream prep needs
Cells per milliliter answers the question “how many cells do I have?” Cell dry weight in grams per liter answers a different question: “how much biomass do I have, and what does my protein or plasmid prep actually yield from it?” The two are not interchangeable. A culture at OD600 1.0 has 1 × 10⁹ cells/mL and roughly 0.36 g/L CDW at the canonical E. coli defaults, which is 0.36 pg per cell — a number that holds remarkably well across mid-log growth. Your downstream Miniprep yields scale with cell number; your downstream protein gel and Bradford assay scale with CDW. Reporting both in the same JSON output, and letting you edit the g/L-per-OD factor, is what makes the tool usable across expression work, fermentation, and teaching labs alike.
Calibration is the only number that survives a Tuesday morning
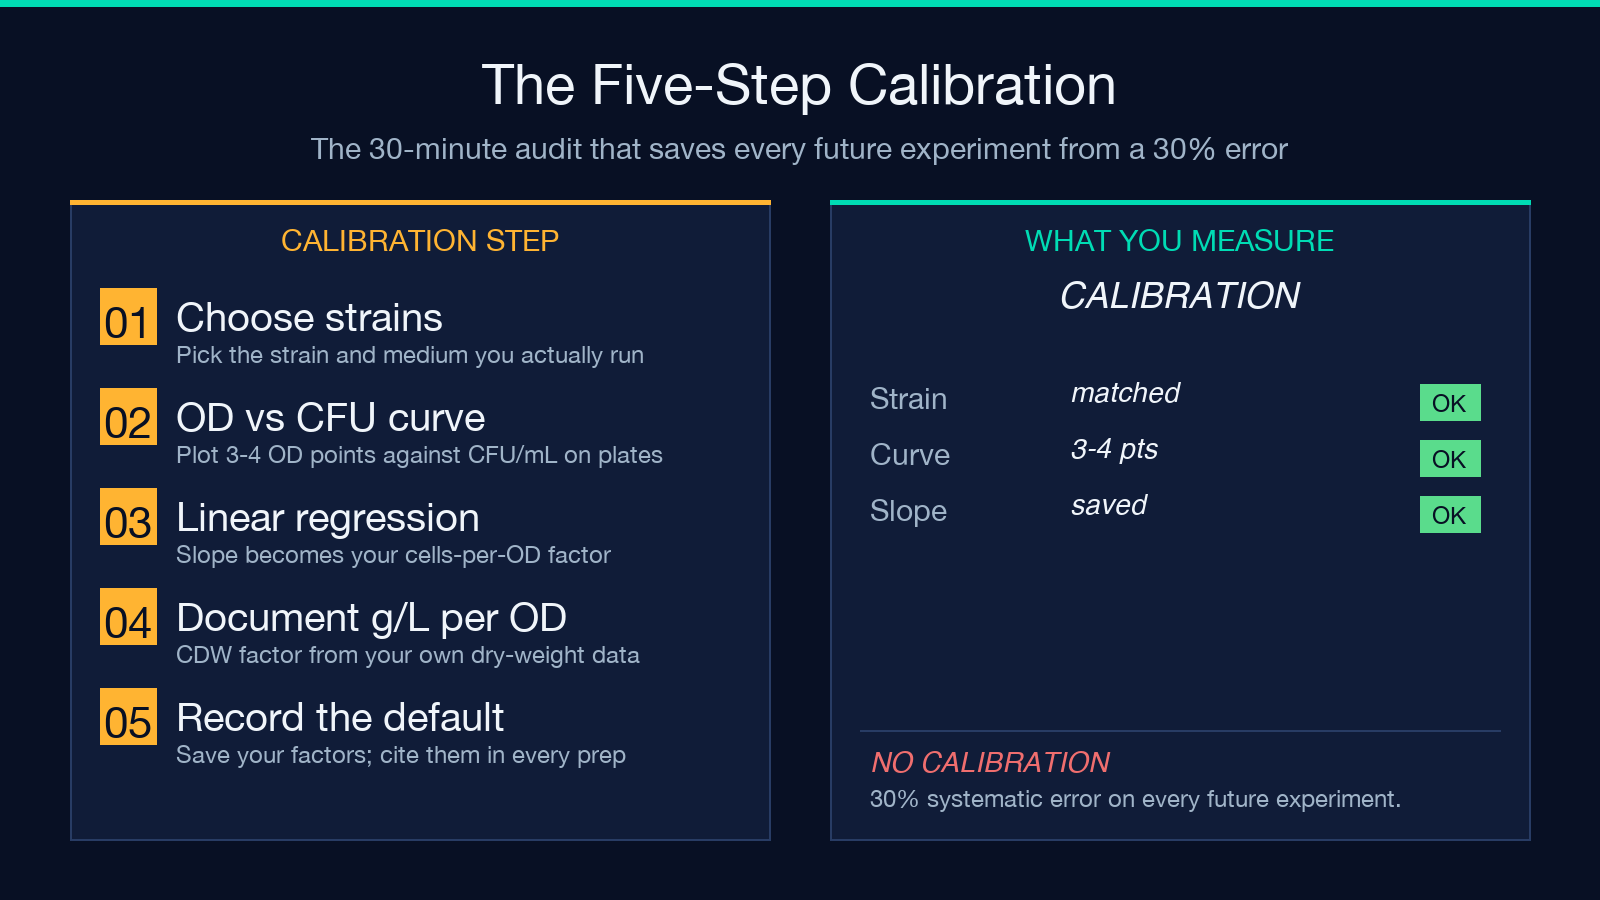
The literature value for E. coli cells per OD is 1 × 10⁹ per mL per OD600 unit at 1 cm — but your instrument, your strain, your medium, and your cuvette will all perturb that number by 10–30%. The standard correction is to run a side-by-side OD600 vs CFU/mL curve on your own culture at three or four OD points, fit a linear regression, and use the slope as your cells-per-OD factor. The calculator does not perform that regression for you, but it makes the editable factor the dominant input rather than a hidden assumption. The 30 minutes spent on calibration will save every future experiment from carrying a 30% systematic error. If you cannot calibrate, document which default you used and on what strain; that is the only honest substitute.
Putting it together: a 25 mL mid-log E. coli sample, end to end
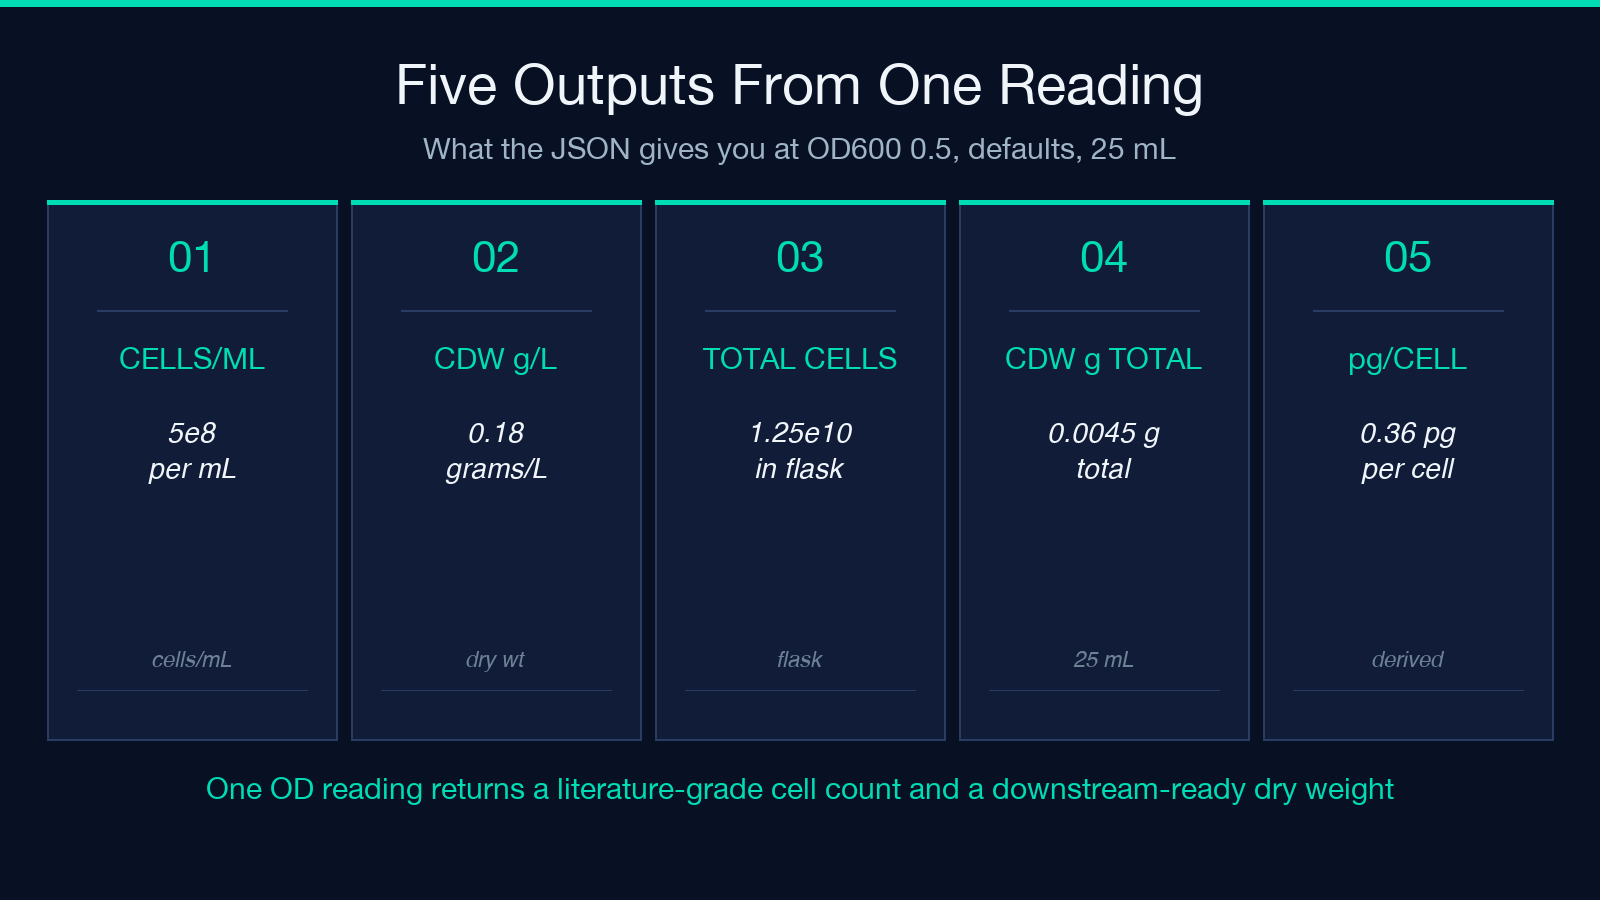
Take an undiluted mid-log E. coli culture, read OD600 = 0.5 in a 1 cm cuvette, no dilution, 25 mL culture volume, defaults for both conversion factors. The calculator returns 5 × 10⁸ cells/mL, 0.18 g/L CDW, 1.25 × 10¹⁰ cells in the flask, 0.0045 g total CDW, and 0.36 pg per cell. Every one of those numbers is recoverable from the math: 0.5 × 1 × 10⁹ = 5 × 10⁸ cells/mL; 0.5 × 0.36 = 0.18 g/L; 5 × 10⁸ × 25 mL = 1.25 × 10¹⁰ cells; 0.18 × 25/1000 = 0.0045 g. The pg/cell figure is the derived constant at those defaults. Run the same calculation through the OD600 calculator, change cellsPerOd to 0.8 × 10⁹ for your strain, and watch the total-cells number move by 20% — that 20% is the calibration uncertainty you just made visible. Try the worked example in your browser at Elysia Tools, then edit both factors to your own strain and see what changes. The defaults are a starting line, not a finish line.
Explore more lab-planning calculators at Elysia Tools.
