
A 1/4 affected risk on every pregnancy is the headline number, but the pedigree probability tree is what gets you there. When a genetic counselor sits down with two cystic fibrosis carriers and asks “what are our chances?”, the answer comes from a step-by-step tree where each parent’s allele goes on its own branch, every branch multiplies by 1/2, and the leaves are summed across the three possible genotypes. That tree — Punnett’s product rule along the branches, the addition rule across them — is what the Pedigree Probability Tree tool formalizes into a calculator for autosomal recessive, autosomal dominant, and X-linked recessive inheritance. This field guide walks through the seven decisions the tree hides, the three formulas that cover most counseling conversations, and the two arithmetic slips that quietly turn a 25% answer into a 50% one.
The Three Inheritance Modes And The One Question Each Answers
Pedigree probability trees are not one calculation. They are three calculations that share a shape but differ in which allele is the “risk allele”, whether sex matters, and what “carrier” means. Pick the wrong one and every downstream number is wrong.
- Autosomal recessive (AR) — the allele is on a non-sex chromosome, two copies cause the disease, one copy is silent. Probability inputs to the tree are carrier probabilities for both parents. The textbook case is two known cystic fibrosis carriers producing a 1/4 affected child.
- Autosomal dominant (AD) — the allele is on a non-sex chromosome, one copy is enough. Probability inputs are affected probabilities (heterozygous assumed). The textbook case is Huntington disease, where each affected parent passes the allele 50% of the time.
- X-linked recessive (XLR) — the allele sits on the X chromosome. The father input is his probability of being affected; the mother input is her probability of being a carrier. Sons get the Y from dad and one X from mom; daughters get dad’s X and one of mom’s two X’s. Per-sex branches matter.
Most counseling questions collapse to one of these three. The mode determines what the input probabilities mean, not just what number you get out — get this wrong and the tree silently produces nonsense. Run the Pedigree Probability Tree on your own pedigree and confirm which mode your alleles actually fit before you trust the number on the page.
How The Tree Actually Builds — Product Then Sum
The tree is two rules layered on top of each other. First, at every split the tool multiplies probabilities along the branches — that is the product rule, and it gives you the joint probability of reaching each leaf. Second, once all leaves are filled in, you sum the probabilities that correspond to “affected” — that is the sum rule, and it gives you the overall risk.
Concretely, for two cystic fibrosis carriers both Aa, the tree has four leaves: AA (1/4), Aa (1/4), aA (1/4), aa (1/4). The first three leaves are unaffected (either homozygous normal or carrier). Only aa — both parents passing the recessive allele — is affected. Sum the aa leaf, get 1/4. That is the headline number.
Where the tree starts to look different from a 1/4 answer is when one parent has a partial probability of being a carrier. If the father’s P(carrier) is only 1/20 because of an unknown family history, then P(father transmits a) = 1/20 × 1/2 = 1/40, and the joint P(aa) collapses from 1/4 to 1/80. The product rule still runs, but the leaves are smaller, and the affected sum drops accordingly. For an X-linked recessive cross, the leaves split per-sex before the allele sum runs, which is why the XLR headline is 1/4 to all children but 1/2 to sons specifically.
Autosomal Recessive — The Two-Carrier Baseline
Two known cystic fibrosis carriers is the textbook case and the easiest tree to verify by hand. Each parent is Aa (heterozygous), so the probability of passing the recessive allele a on any given gamete is exactly 1/2. The tree multiplies the two transmission probabilities:
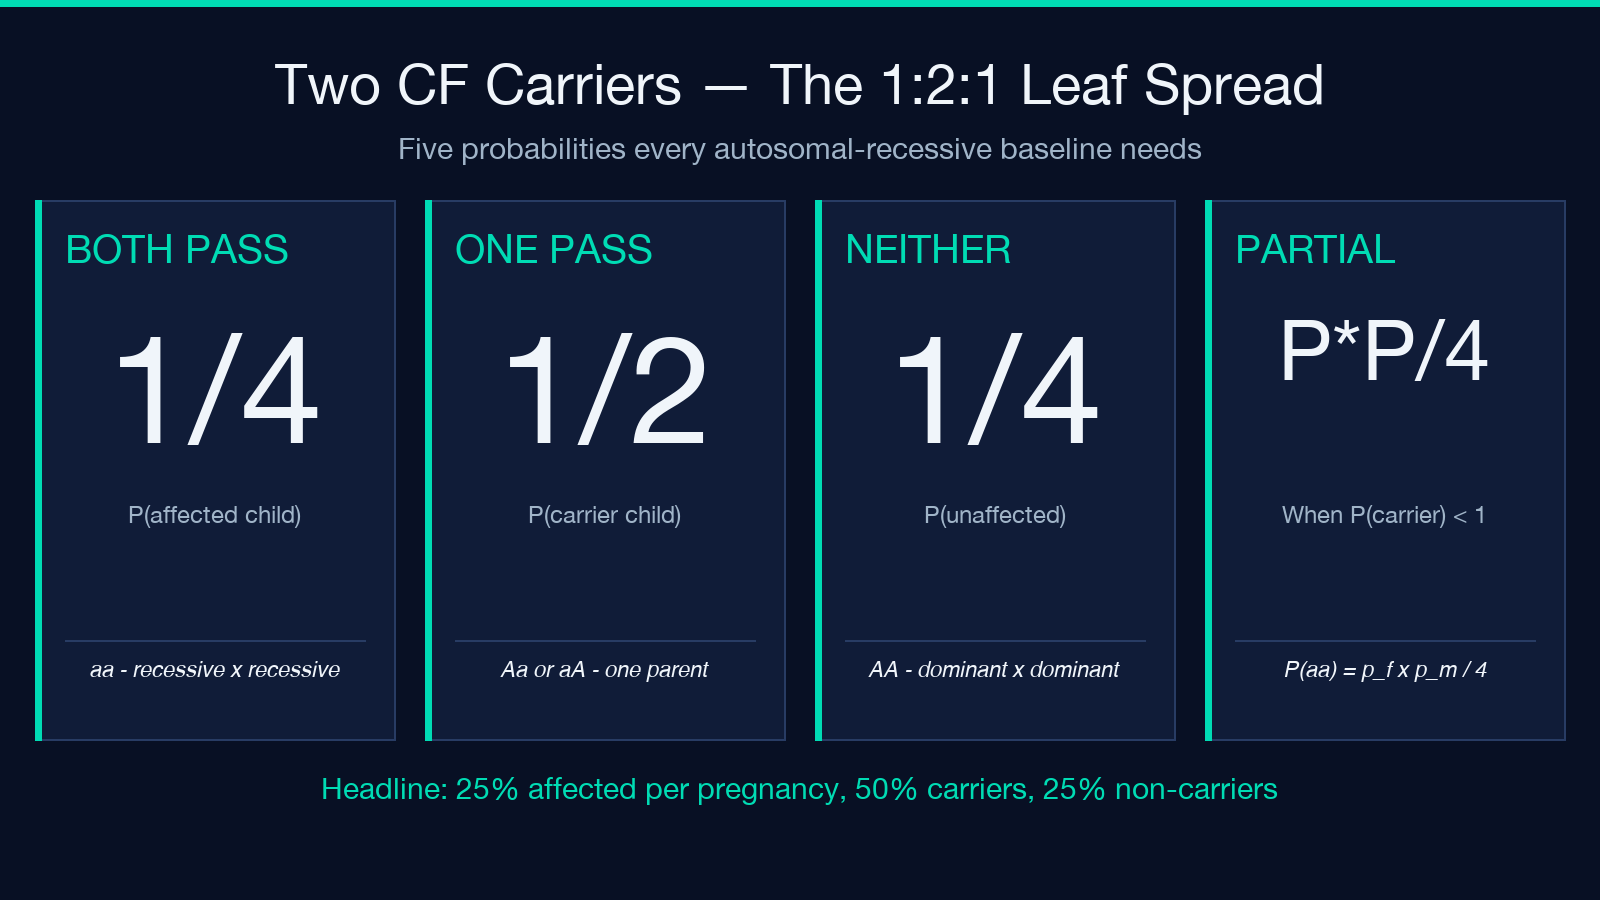
- P(father transmits
a) = 1 × 1/2 = 1/2 - P(mother transmits
a) = 1 × 1/2 = 1/2 - P(affected child,
aa) = 1/2 × 1/2 = 1/4 - P(carrier child,
AaoraA) = 1/2 - P(unaffected non-carrier,
AA) = 1/4
The 1:2:1 ratio across the three genotype leaves is the Mendelian baseline for any autosomal recessive cross between two heterozygotes. Watch every leaf get filled in on the Elysia Tools calculator.
Where the calculation drifts is when one parent’s carrier probability drops below 1. Cystic fibrosis in populations of Northern European descent has a carrier frequency around 1/25, which means a person with no family history still has roughly 1/25 probability of being a carrier. Plug that in and the P(affected) per child collapses to 1/400 — a useful sanity check for any pedigree that does not start from “we already know both parents are carriers”.
Autosomal Dominant — When Affected Means Heterozygous
Autosomal dominant inheritance flips one assumption: the disease allele is dominant, so one copy is enough to express the phenotype. The probability inputs to the tree are now P(affected) for each parent, and the dominant allele is typically assumed heterozygous because homozygous dominant is often lethal or vanishingly rare.
For Huntington disease, each affected parent passes the dominant allele with probability 1/2. If both parents are affected:
- P(either parent transmits allele) = 1 × 1/2 = 1/2 (per parent)
- P(child gets allele from at least one parent) = 1 − P(neither transmits) = 1 − 1/4 = 3/4
- P(unaffected child) = 1/4
The 3/4 affected headline is the one every genetic counselor quotes. It is also the one most often miscounted by hand, because the obvious wrong answer is 1/2 (assuming only one parent matters) or 1 (assuming both parents always transmit). The sum rule across leaves with at least one dominant allele is what gets to 3/4.
Homozygous dominant Huntington is essentially never observed, so the canonical tree stops at the heterozygous assumption. If your pedigree carries a known homozygous-dominant case, the autosomal-dominant mode on the Pedigree Probability Tree tool handles it via a homozygous-input option.
X-Linked Recessive — Where Sex Splits The Leaves
X-linked recessive inheritance is where the tree grows per-sex branches, because the inheritance pattern is different on the X chromosome for sons versus daughters. A carrier mother (Xᴬ Xᵃ) and an unaffected father (Xᴬ Y) produce four equally likely children:
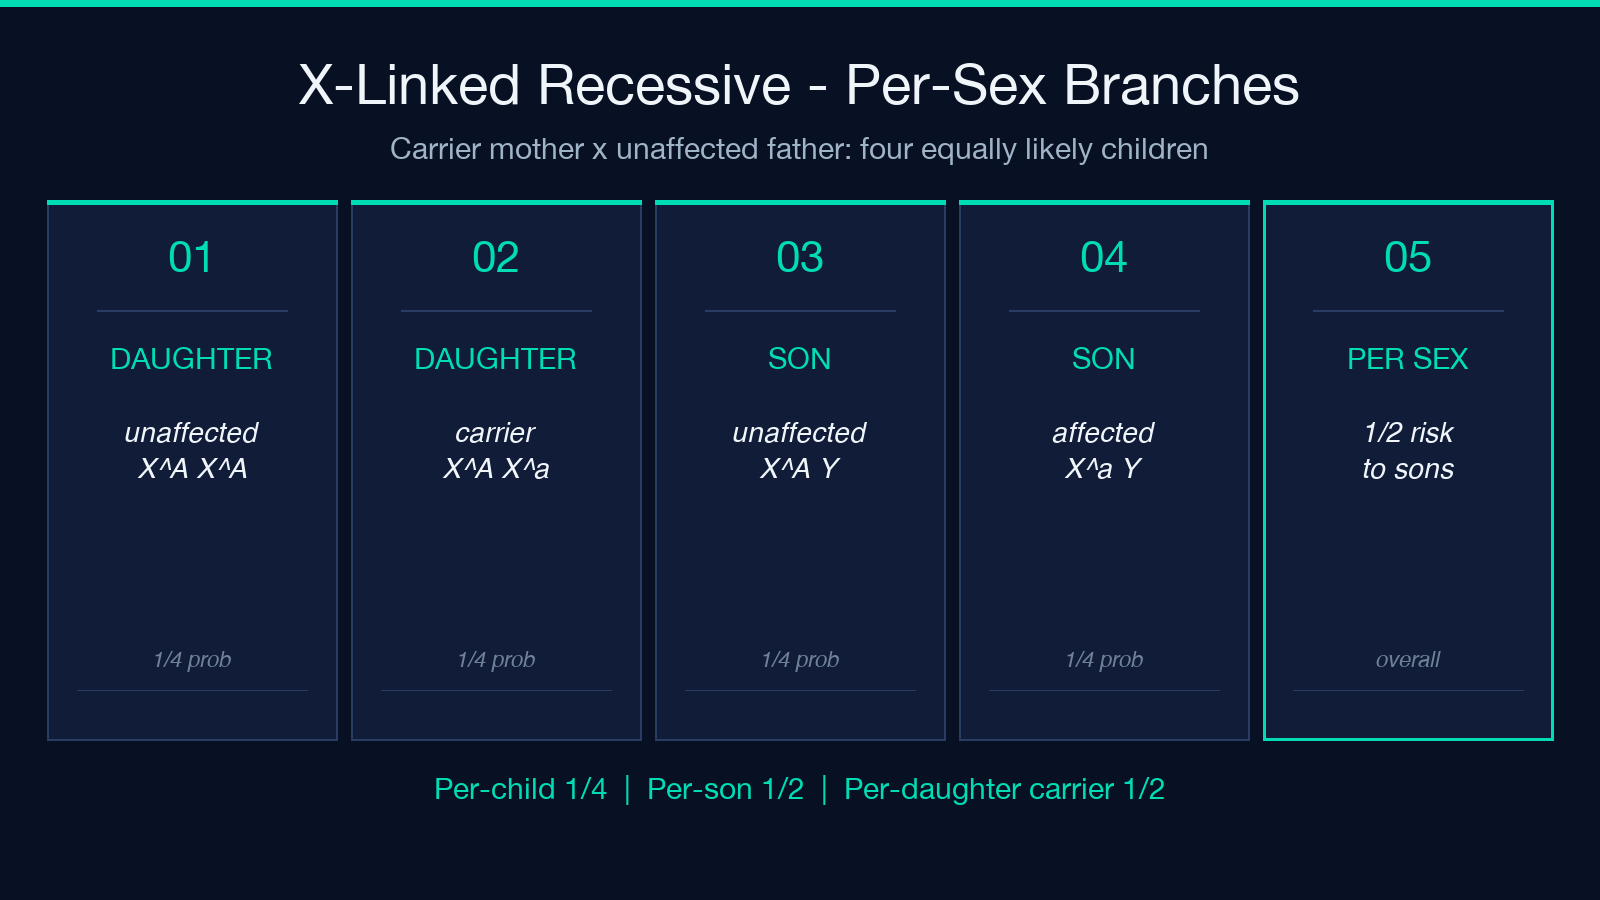
- Daughter, Xᴬ Xᴬ — unaffected non-carrier, 1/4
- Daughter, Xᴬ Xᵃ — carrier like mom, 1/4
- Son, Xᴬ Y — unaffected, 1/4
- Son, Xᵃ Y — affected (hemophilia A pattern), 1/4
The per-sex breakdown matters because the overall child risk is 1/4 affected — but the risk to sons specifically is 1/2, and the risk to daughters specifically of being carriers is also 1/2. Quoting “1/4” without separating by sex hides the actual counseling-relevant numbers. The XLR mode of the Pedigree Probability Tree tool reports both views.
The arithmetic trap is multiplying by 1/2 in the wrong place. For X-linked recessive, the mother’s two X’s give 1/2 transmission probability on her side; the father either gives Xᴬ or Y to sons, and always gives his single Xᴬ to daughters. So the carrier-daughter probability is not 1/2 of all children — it is 1/2 of daughters, and the same daughter probability arises from a different mechanism than the affected-son probability. Confusing the two is the most common XLR miscount.
Two Arithmetic Slips That Quietly Double The Answer
Two mistakes account for most of the “the tool said X but my spreadsheet said Y” reports.
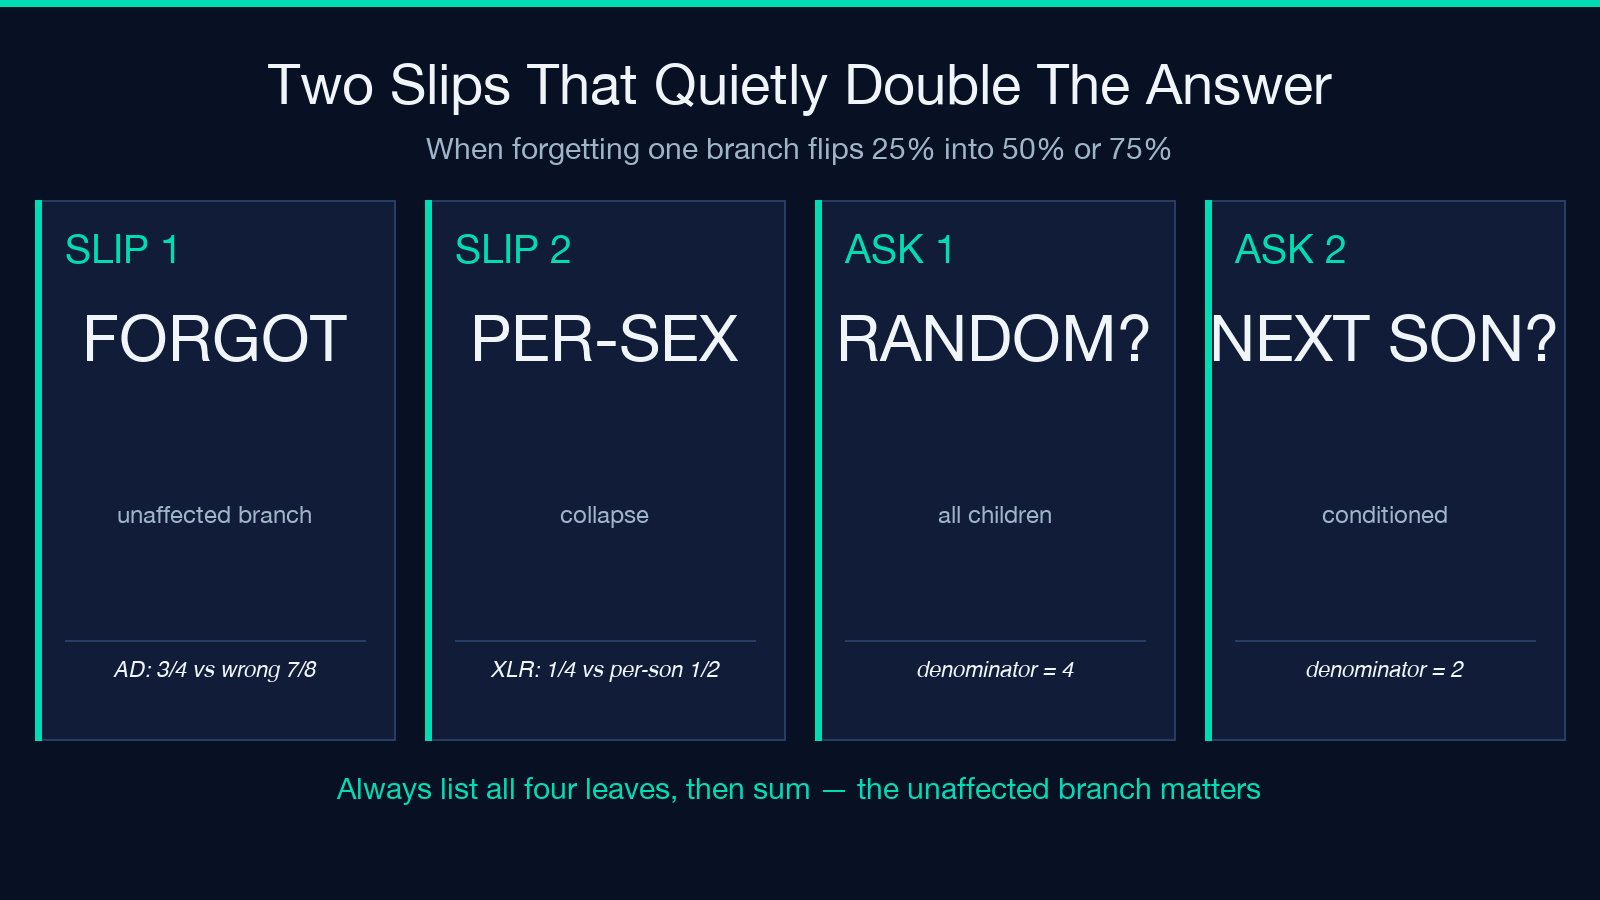
The first slip is forgetting the unaffected branch. On an autosomal dominant cross with both parents affected, the four leaves are: child gets allele from neither parent (1/4, unaffected), child gets allele from father only (1/4, affected), child gets allele from mother only (1/4, affected), child gets allele from both parents (1/4, affected). Summing the affected leaves gives 3/4 — but if you forget the 1/4 unaffected branch and sum only the “at least one allele” leaves naively, you will count that 1/4 branch twice and land on a wrong 7/8 or similar. Always enumerate all four leaves, then sum.
The second slip is the per-sex collapse on X-linked recessive. If you are asked “what is the probability that a random child from a carrier mother × unaffected father is affected?”, the answer is 1/4 (only sons can be affected, and only half of sons are). If you are asked “what is the probability that the next son is affected?”, the answer is 1/2 (we are conditioning on the child being a son). The two questions sound identical in a counseling conversation but have different denominators. The tool reports both, but only if you tell it which one you want.
When The Tree Stops Being Enough
Pedigree probability trees are accurate for single-gene inheritance with the standard Mendelian assumptions: two alleles per locus, complete penetrance, no new mutations, no mosaicism, no imprinting. As soon as any of those assumptions breaks, the tree’s leaves become approximations rather than exact probabilities.
The cases where the tree is not enough:
- Incomplete penetrance — an allele carrier who does not express the phenotype. BRCA1 mutations are the textbook example. The tree needs a penetrance factor multiplied into the affected leaves.
- Polygenic risk — most common diseases (type 2 diabetes, schizophrenia) involve hundreds of loci. There is no single tree; risk comes from a polygenic score.
- Mitochondrial inheritance — passed from mother to all children, never from father. The tree is single-branch (mother’s allele) and does not split on sex.
- De novo mutations — a fraction of affected children have unaffected parents because the mutation arose in the egg or sperm. The tree’s “1/4 affected” assumes the allele was inherited, not new.
For any pedigree that touches one of these four cases, the Pedigree Probability Tree tool’s output is a starting point, not an answer. Use it to anchor the conversation, then add the relevant modifier (penetrance factor, polygenic score, mitochondrial branch, de novo rate) on top.
Closing — What The Tree Is And Is Not Good For
A pedigree probability tree is the right tool for single-gene Mendelian inheritance across three modes — autosomal recessive, autosomal dominant, X-linked recessive — when penetrance is complete, alleles are independent, and the question is “what is the risk to this specific child?”. It is the wrong tool for polygenic risk, incomplete penetrance, mitochondrial inheritance, and de novo mutation. When in doubt, run the tree as a sanity check on the inheritance mode you think you are dealing with, then add the relevant modifier on top.
For more tools and field guides across genetics, statistics, and data analysis, explore elysiatools.com.
