A markdown converter looks trivial until it isn't. The value of a good one is making the seven small decisions visible so you can make them on purpose.
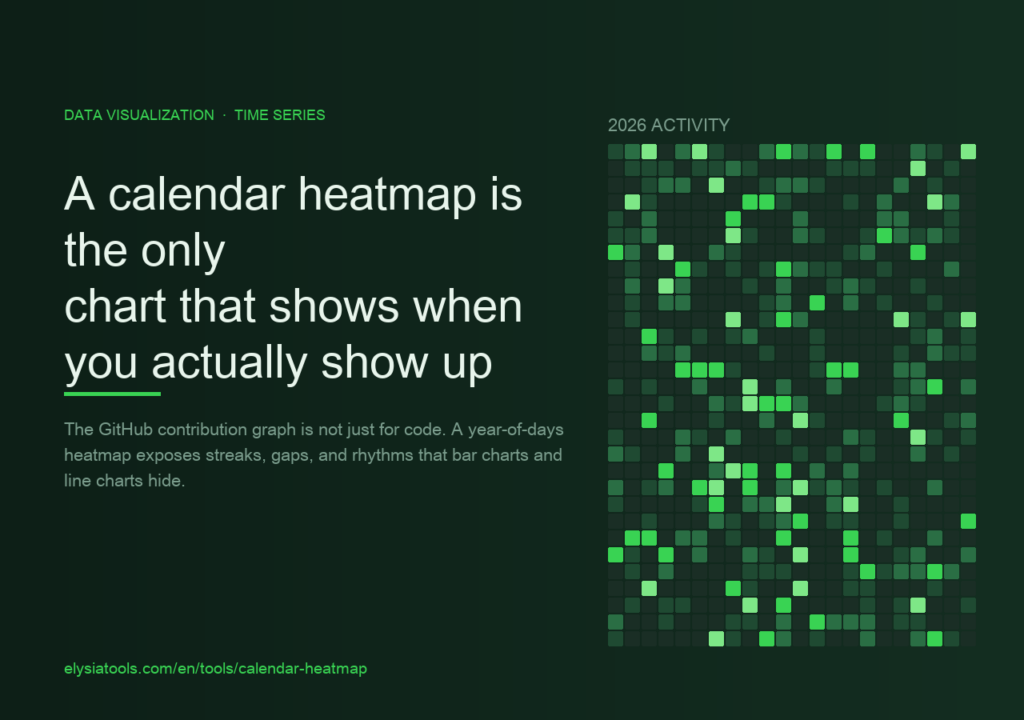
The GitHub contribution graph is not just for code. Used on the right data, a year-of-days heatmap exposes streaks, gaps, and seasonal rhythms that bar charts and line charts actively hide.