A network chart shows the data after the layout algorithm has decided which features to amplify. Force-directed rewards connectivity. Circular rewards symmetry. Grid rewards order. Pick the layout first, then read the chart.
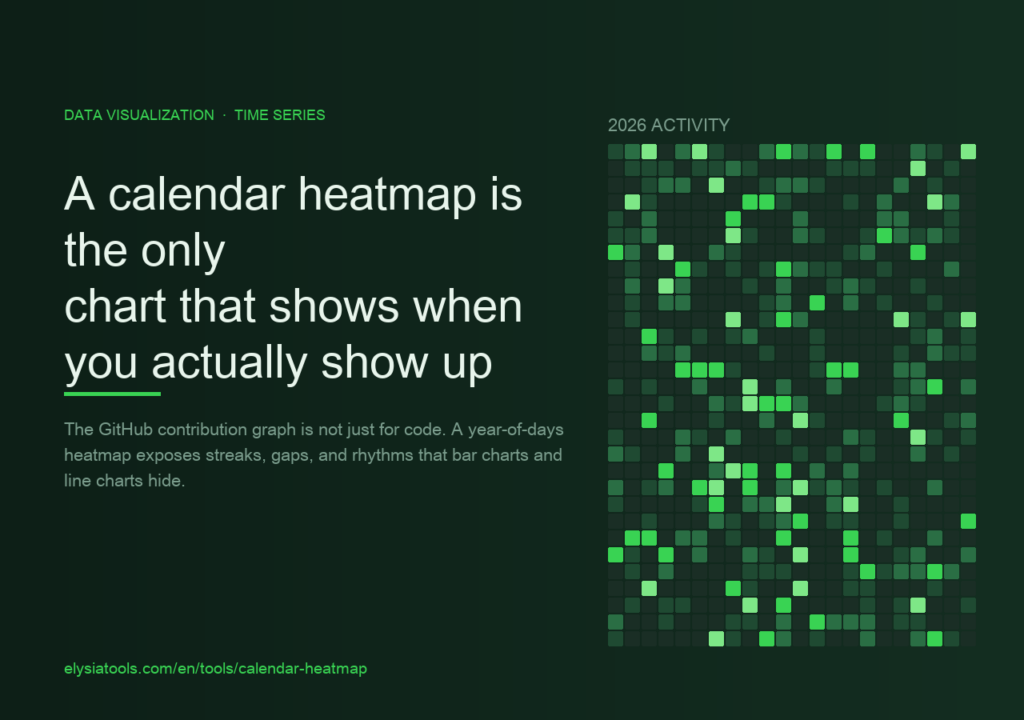
The GitHub contribution graph is not just for code. Used on the right data, a year-of-days heatmap exposes streaks, gaps, and seasonal rhythms that bar charts and line charts actively hide.