We tend to think of WebP as the format that buys us smaller hero images and faster page loads. But what if every WebP/VP8 file already carries a hidden 3D...
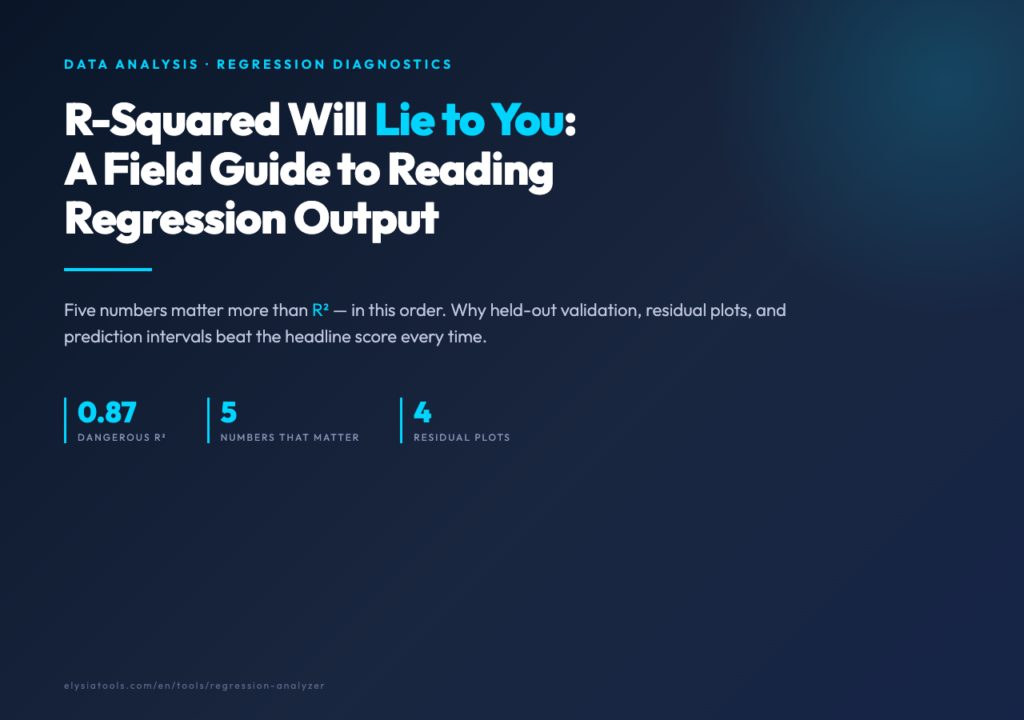
Five numbers matter more than R-squared — and in this order. Why held-out validation, residual plots, and prediction intervals beat the headline score every time, and a practical workflow for shipping models that survive production.
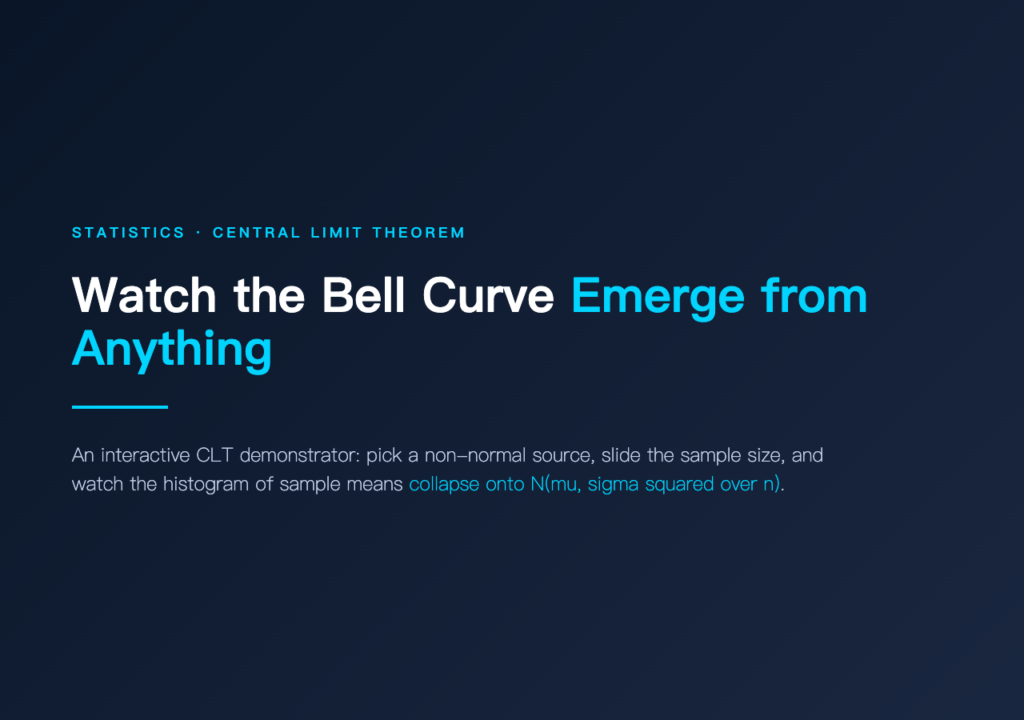
An interactive visual proof that the distribution of sample means converges to a Normal bell curve regardless of source distribution, plus four controls and four source distributions you can dial in.
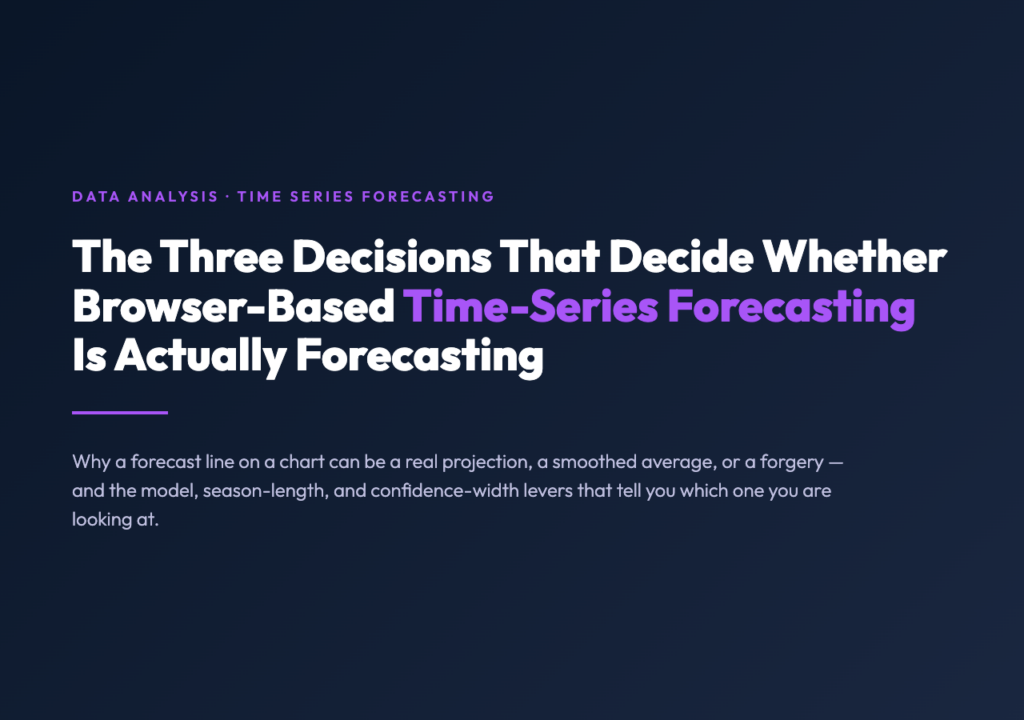
Why a forecast line on a chart can be a real projection, a smoothed average, or a forgery — and the model, season-length, and confidence-width levers that tell you which one you are looking at.
A network chart shows the data after the layout algorithm has decided which features to amplify. Force-directed rewards connectivity. Circular rewards symmetry. Grid rewards order. Pick the layout first, then read the chart.