A single p-value is not a decision. Here are the three numbers — p-value, lift, confidence interval — that turn a dashboard spike into a verdict you can defend, plus how Bonferroni and sequential-testing corrections keep multiple A/B tests honest.
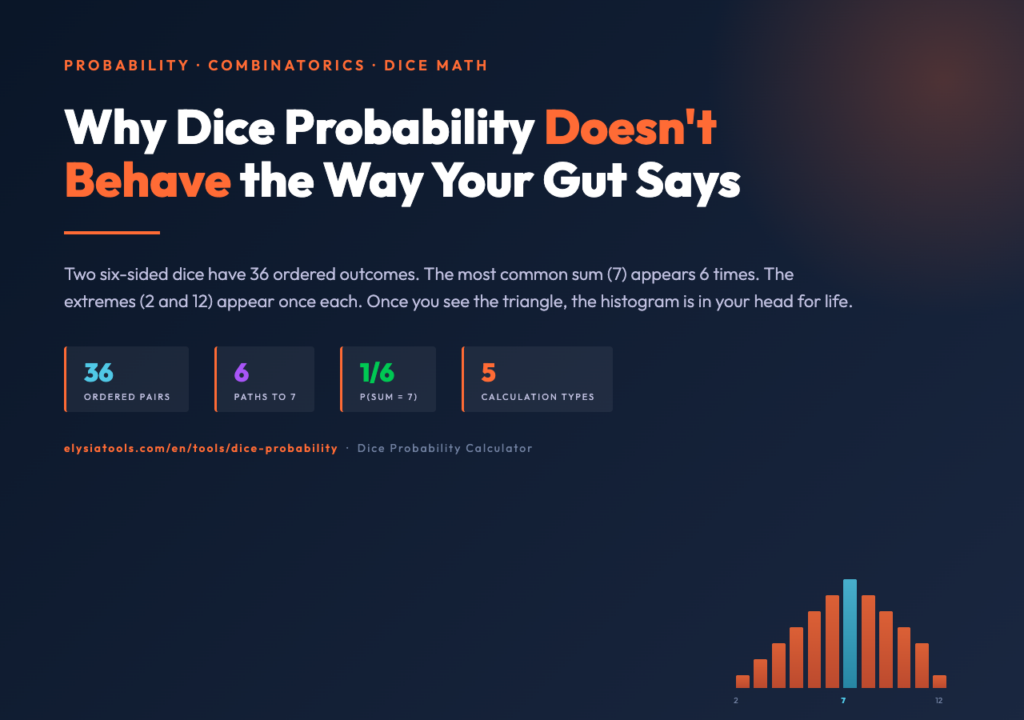
Two six-sided dice have 36 ordered outcomes. Sum 7 hits 1/6 of the time. The triangular histogram is your mental model for craps, Yahtzee, Catan robber rolls, and every D&D attack roll.
Adjusted R-squared is the correction that penalizes each new variable for not pulling its weight. Use it to compare nested models instead of chasing raw R².
Five numbers matter more than R-squared — and in this order. Why held-out validation, residual plots, and prediction intervals beat the headline score every time, and a practical workflow for shipping models that survive production.
An interactive visual proof that the distribution of sample means converges to a Normal bell curve regardless of source distribution, plus four controls and four source distributions you can dial in.